Immigrants from Ireland vs Eastern European No Schooling Completed
COMPARE
Immigrants from Ireland
Eastern European
No Schooling Completed
No Schooling Completed Comparison
Immigrants from Ireland
Eastern Europeans
1.8%
NO SCHOOLING COMPLETED
98.4/ 100
METRIC RATING
97th/ 347
METRIC RANK
1.6%
NO SCHOOLING COMPLETED
100.0/ 100
METRIC RATING
35th/ 347
METRIC RANK
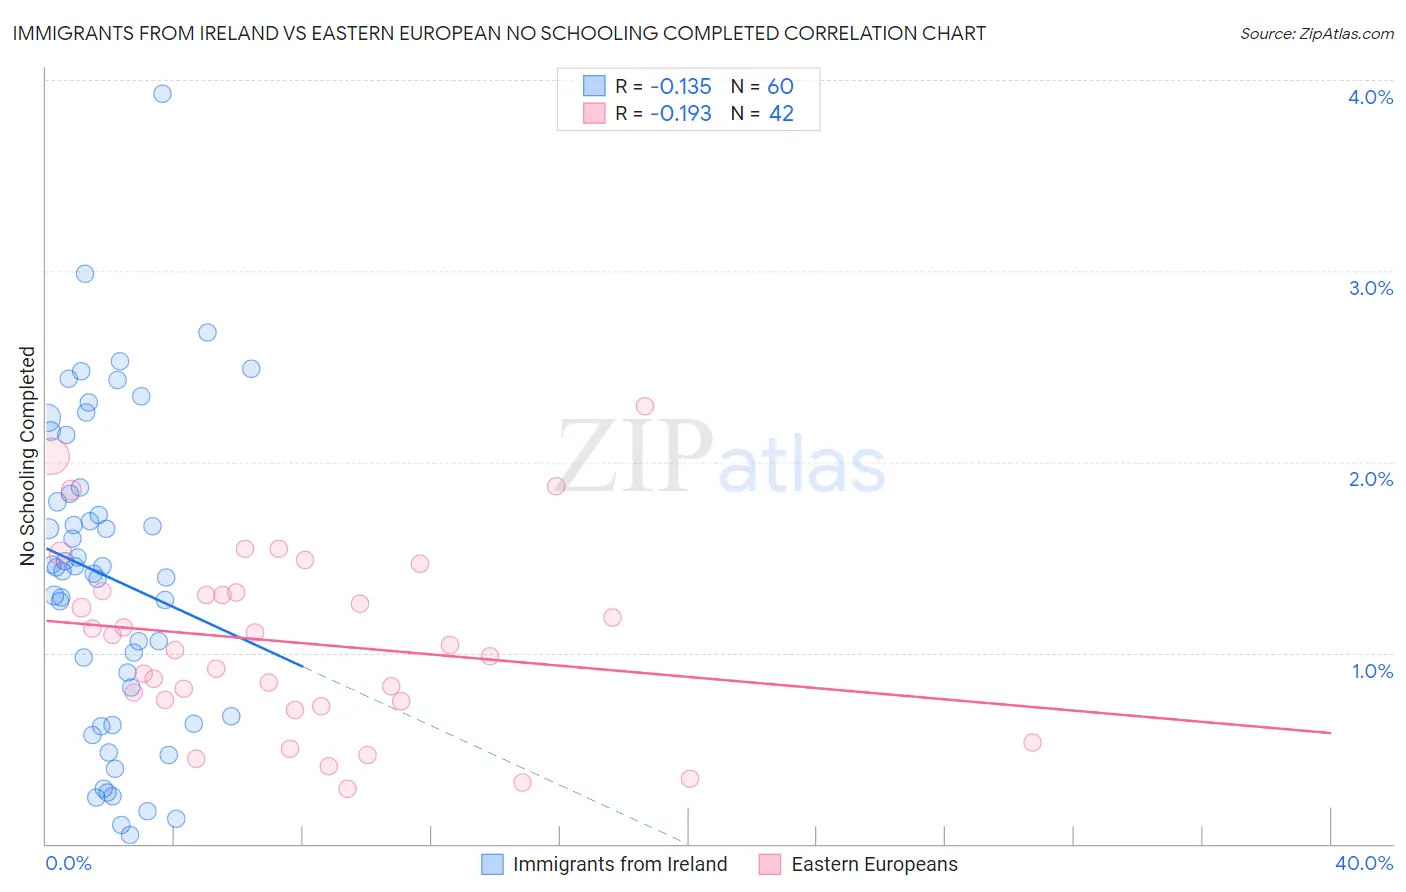
Immigrants from Ireland vs Eastern European No Schooling Completed Correlation Chart
The statistical analysis conducted on geographies consisting of 238,979,486 people shows a poor negative correlation between the proportion of Immigrants from Ireland and percentage of population with no schooling in the United States with a correlation coefficient (R) of -0.135 and weighted average of 1.8%. Similarly, the statistical analysis conducted on geographies consisting of 452,907,345 people shows a poor negative correlation between the proportion of Eastern Europeans and percentage of population with no schooling in the United States with a correlation coefficient (R) of -0.193 and weighted average of 1.6%, a difference of 15.9%.
No Schooling Completed Correlation Summary
| Measurement | Immigrants from Ireland | Eastern European |
| Minimum | 0.045% | 0.29% |
| Maximum | 3.9% | 2.3% |
| Range | 3.9% | 2.0% |
| Mean | 1.4% | 1.1% |
| Median | 1.4% | 1.0% |
| Interquartile 25% (IQ1) | 0.65% | 0.74% |
| Interquartile 75% (IQ3) | 1.8% | 1.3% |
| Interquartile Range (IQR) | 1.2% | 0.57% |
| Standard Deviation (Sample) | 0.83% | 0.48% |
| Standard Deviation (Population) | 0.82% | 0.47% |
Similar Demographics by No Schooling Completed
Demographics Similar to Immigrants from Ireland by No Schooling Completed
In terms of no schooling completed, the demographic groups most similar to Immigrants from Ireland are Bhutanese (1.8%, a difference of 0.18%), Iranian (1.8%, a difference of 0.28%), Puget Sound Salish (1.8%, a difference of 0.41%), Nonimmigrants (1.8%, a difference of 0.42%), and Choctaw (1.8%, a difference of 0.47%).
| Demographics | Rating | Rank | No Schooling Completed |
| Sioux | 99.0 /100 | #90 | Exceptional 1.8% |
| Immigrants | Germany | 99.0 /100 | #91 | Exceptional 1.8% |
| Romanians | 98.8 /100 | #92 | Exceptional 1.8% |
| Turks | 98.7 /100 | #93 | Exceptional 1.8% |
| Immigrants | Nonimmigrants | 98.5 /100 | #94 | Exceptional 1.8% |
| Puget Sound Salish | 98.5 /100 | #95 | Exceptional 1.8% |
| Bhutanese | 98.4 /100 | #96 | Exceptional 1.8% |
| Immigrants | Ireland | 98.4 /100 | #97 | Exceptional 1.8% |
| Iranians | 98.2 /100 | #98 | Exceptional 1.8% |
| Choctaw | 98.1 /100 | #99 | Exceptional 1.8% |
| Immigrants | Singapore | 98.0 /100 | #100 | Exceptional 1.8% |
| Immigrants | Czechoslovakia | 97.9 /100 | #101 | Exceptional 1.8% |
| Immigrants | Switzerland | 97.9 /100 | #102 | Exceptional 1.8% |
| Basques | 97.9 /100 | #103 | Exceptional 1.8% |
| Thais | 97.5 /100 | #104 | Exceptional 1.8% |
Demographics Similar to Eastern Europeans by No Schooling Completed
In terms of no schooling completed, the demographic groups most similar to Eastern Europeans are Latvian (1.5%, a difference of 0.95%), Aleut (1.6%, a difference of 1.0%), Italian (1.5%, a difference of 1.2%), Belgian (1.6%, a difference of 1.3%), and Northern European (1.6%, a difference of 1.4%).
| Demographics | Rating | Rank | No Schooling Completed |
| French Canadians | 100.0 /100 | #28 | Exceptional 1.5% |
| Lumbee | 100.0 /100 | #29 | Exceptional 1.5% |
| British | 100.0 /100 | #30 | Exceptional 1.5% |
| Inupiat | 100.0 /100 | #31 | Exceptional 1.5% |
| Swiss | 100.0 /100 | #32 | Exceptional 1.5% |
| Italians | 100.0 /100 | #33 | Exceptional 1.5% |
| Latvians | 100.0 /100 | #34 | Exceptional 1.5% |
| Eastern Europeans | 100.0 /100 | #35 | Exceptional 1.6% |
| Aleuts | 99.9 /100 | #36 | Exceptional 1.6% |
| Belgians | 99.9 /100 | #37 | Exceptional 1.6% |
| Northern Europeans | 99.9 /100 | #38 | Exceptional 1.6% |
| Native Hawaiians | 99.9 /100 | #39 | Exceptional 1.6% |
| Luxembourgers | 99.9 /100 | #40 | Exceptional 1.6% |
| Hungarians | 99.9 /100 | #41 | Exceptional 1.6% |
| Bulgarians | 99.9 /100 | #42 | Exceptional 1.6% |