Immigrants from Yemen vs Slovene GED/Equivalency

COMPARE

Immigrants from Yemen
Race
Ancestry
AfghanAfricanAlaska NativeAlaskan AthabascanAlbanianAleutAlsatianAmericanApacheArabArapahoArgentineanArmenianAssyrian/Chaldean/SyriacAustralianAustrianBahamianBangladeshiBarbadianBasqueBelgianBelizeanBermudanBhutaneseBlackfeetBolivianBrazilianBritishBritish West IndianBulgarianBurmeseCajunCambodianCanadianCape VerdeanCarpatho RusynCelticCentral AmericanCentral American IndianCherokeeCheyenneChickasawChileanChineseChippewaChoctawColombianColvilleComancheCosta RicanCreeCreekCroatianCrowCubanCypriotCzechCzechoslovakianDanishDelawareDominicanDutchDutch West IndianEastern EuropeanEcuadorianEgyptianEnglishEstonianEthiopianEuropeanFijianFilipinoFinnishFrenchFrench American IndianFrench CanadianGermanGerman RussianGhanaianGreekGuamanian/ChamorroGuatemalanGuyaneseHaitianHmongHonduranHopiHoumaHungarianIcelanderIndian (Asian)IndonesianInupiatIranianIraqiIrishIroquoisIsraeliItalianJamaicanJapaneseJordanianKenyanKiowaKoreanLaotianLatvianLebaneseLiberianLithuanianLumbeeLuxembourgerMacedonianMalaysianMalteseMarshalleseMenomineeMexicanMexican American IndianMongolianMoroccanNative HawaiianNavajoNepaleseNew ZealanderNicaraguanNigerianNorthern EuropeanNorwegianOkinawanOsageOttawaPaiutePakistaniPalestinianPanamanianParaguayanPennsylvania GermanPeruvianPimaPolishPortuguesePotawatomiPuebloPuerto RicanPuget Sound SalishRomanianRussianSalvadoranSamoanScandinavianScotch-IrishScottishSeminoleSenegaleseSerbianShoshoneSierra LeoneanSiouxSlavicSlovakSomaliSouth AfricanSouth AmericanSouth American IndianSoviet UnionSpaniardSpanishSpanish AmericanSpanish American IndianSri LankanSubsaharan AfricanSudaneseSwedishSwissSyrianTaiwaneseThaiTlingit-HaidaTohono O'OdhamTonganTrinidadian and TobagonianTsimshianTurkishU.S. Virgin IslanderUgandanUkrainianUruguayanUteVenezuelanVietnameseWelshWest IndianYakamaYaquiYugoslavianYumanYup'ikZimbabwean
Immigration
NonimmigrantsImmigrantsAfghanistanAfricaAlbaniaArgentinaArmeniaAsiaAustraliaAustriaBahamasBangladeshBarbadosBelarusBelgiumBelizeBoliviaBosnia and HerzegovinaBrazilBulgariaBurma/MyanmarCabo VerdeCambodiaCameroonCanadaCaribbeanCentral AmericaChileChinaColombiaCongoCosta RicaCroatiaCubaCzechoslovakiaDenmarkDominicaDominican RepublicEastern AfricaEastern AsiaEastern EuropeEcuadorEgyptEl SalvadorEnglandEritreaEthiopiaEuropeFijiFranceGermanyGhanaGreeceGrenadaGuatemalaGuyanaHaitiHondurasHong KongHungaryIndiaIndonesiaIranIraqIrelandIsraelItalyJamaicaJapanJordanKazakhstanKenyaKoreaKuwaitLaosLatin AmericaLatviaLebanonLiberiaLithuaniaMalaysiaMexicoMicronesiaMiddle AfricaMoldovaMoroccoNepalNetherlandsNicaraguaNigeriaNorth AmericaNorth MacedoniaNorthern AfricaNorthern EuropeNorwayOceaniaPakistanPanamaPeruPhilippinesPolandPortugalRomaniaRussiaSaudi ArabiaScotlandSenegalSerbiaSierra LeoneSingaporeSomaliaSouth AfricaSouth AmericaSouth Central AsiaSouth Eastern AsiaSouthern EuropeSpainSri LankaSt. Vincent and the GrenadinesSudanSwedenSwitzerlandSyriaTaiwanThailandTrinidad and TobagoTurkeyUgandaUkraineUruguayUzbekistanVenezuelaVietnamWest IndiesWestern AfricaWestern AsiaWestern EuropeYemenZaireZimbabweAzores
Slovene
Race
Ancestry
AfghanAfricanAlaska NativeAlaskan AthabascanAlbanianAleutAlsatianAmericanApacheArabArapahoArgentineanArmenianAssyrian/Chaldean/SyriacAustralianAustrianBahamianBangladeshiBarbadianBasqueBelgianBelizeanBermudanBhutaneseBlackfeetBolivianBrazilianBritishBritish West IndianBulgarianBurmeseCajunCambodianCanadianCape VerdeanCarpatho RusynCelticCentral AmericanCentral American IndianCherokeeCheyenneChickasawChileanChineseChippewaChoctawColombianColvilleComancheCosta RicanCreeCreekCroatianCrowCubanCypriotCzechCzechoslovakianDanishDelawareDominicanDutchDutch West IndianEastern EuropeanEcuadorianEgyptianEnglishEstonianEthiopianEuropeanFijianFilipinoFinnishFrenchFrench American IndianFrench CanadianGermanGerman RussianGhanaianGreekGuamanian/ChamorroGuatemalanGuyaneseHaitianHmongHonduranHopiHoumaHungarianIcelanderIndian (Asian)IndonesianInupiatIranianIraqiIrishIroquoisIsraeliItalianJamaicanJapaneseJordanianKenyanKiowaKoreanLaotianLatvianLebaneseLiberianLithuanianLumbeeLuxembourgerMacedonianMalaysianMalteseMarshalleseMenomineeMexicanMexican American IndianMongolianMoroccanNative HawaiianNavajoNepaleseNew ZealanderNicaraguanNigerianNorthern EuropeanNorwegianOkinawanOsageOttawaPaiutePakistaniPalestinianPanamanianParaguayanPennsylvania GermanPeruvianPimaPolishPortuguesePotawatomiPuebloPuerto RicanPuget Sound SalishRomanianRussianSalvadoranSamoanScandinavianScotch-IrishScottishSeminoleSenegaleseSerbianShoshoneSierra LeoneanSiouxSlavicSlovakSloveneSomaliSouth AfricanSouth AmericanSouth American IndianSoviet UnionSpaniardSpanishSpanish AmericanSpanish American IndianSri LankanSubsaharan AfricanSudaneseSwedishSwissSyrianTaiwaneseThaiTlingit-HaidaTohono O'OdhamTonganTrinidadian and TobagonianTsimshianTurkishU.S. Virgin IslanderUgandanUkrainianUruguayanUteVenezuelanVietnameseWelshWest IndianYakamaYaquiYugoslavianYumanYup'ikZimbabwean
Immigration
NonimmigrantsImmigrantsAfghanistanAfricaAlbaniaArgentinaArmeniaAsiaAustraliaAustriaBahamasBangladeshBarbadosBelarusBelgiumBelizeBoliviaBosnia and HerzegovinaBrazilBulgariaBurma/MyanmarCabo VerdeCambodiaCameroonCanadaCaribbeanCentral AmericaChileChinaColombiaCongoCosta RicaCroatiaCubaCzechoslovakiaDenmarkDominicaDominican RepublicEastern AfricaEastern AsiaEastern EuropeEcuadorEgyptEl SalvadorEnglandEritreaEthiopiaEuropeFijiFranceGermanyGhanaGreeceGrenadaGuatemalaGuyanaHaitiHondurasHong KongHungaryIndiaIndonesiaIranIraqIrelandIsraelItalyJamaicaJapanJordanKazakhstanKenyaKoreaKuwaitLaosLatin AmericaLatviaLebanonLiberiaLithuaniaMalaysiaMexicoMicronesiaMiddle AfricaMoldovaMoroccoNepalNetherlandsNicaraguaNigeriaNorth AmericaNorth MacedoniaNorthern AfricaNorthern EuropeNorwayOceaniaPakistanPanamaPeruPhilippinesPolandPortugalRomaniaRussiaSaudi ArabiaScotlandSenegalSerbiaSierra LeoneSingaporeSomaliaSouth AfricaSouth AmericaSouth Central AsiaSouth Eastern AsiaSouthern EuropeSpainSri LankaSt. Vincent and the GrenadinesSudanSwedenSwitzerlandSyriaTaiwanThailandTrinidad and TobagoTurkeyUgandaUkraineUruguayUzbekistanVenezuelaVietnamWest IndiesWestern AfricaWestern AsiaWestern EuropeZaireZimbabweAzores
GED/Equivalency
Income
Poverty
Unemployment
Labor Participation
Family Structure
Vehicle Availability
Education Level
Disability

GED/Equivalency Comparison

Immigrants from Yemen

Slovenes

Tragic
Exceptional
77.9%
GED/EQUIVALENCY
0.0/ 100
METRIC RATING
337th/ 347
METRIC RANK
88.8%
GED/EQUIVALENCY
99.9/ 100
METRIC RATING
18th/ 347
METRIC RANK

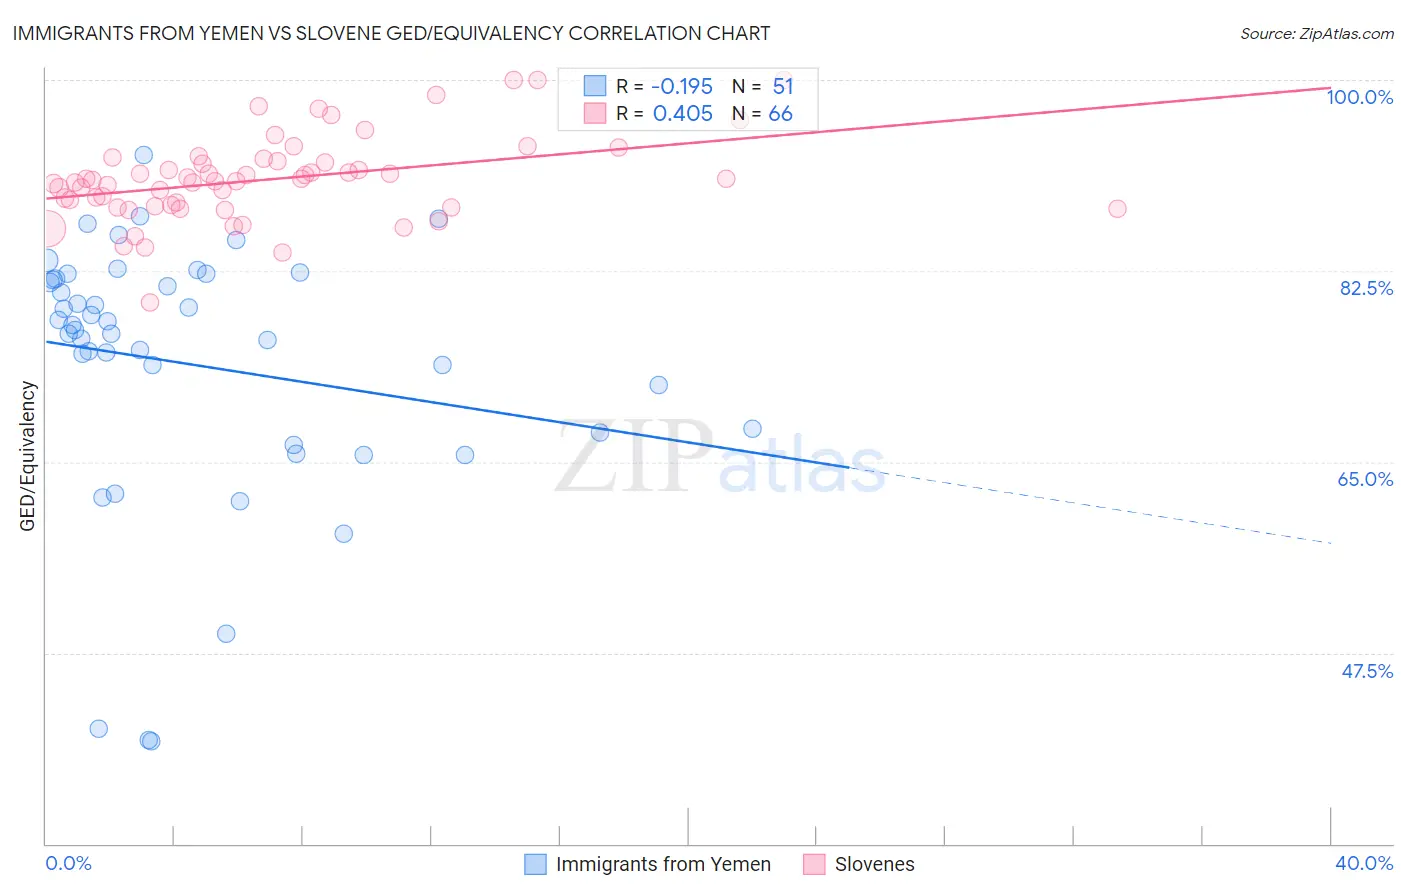
Immigrants from Yemen vs Slovene GED/Equivalency Correlation Chart

The statistical analysis conducted on geographies consisting of 82,433,611 people shows a poor negative correlation between the proportion of Immigrants from Yemen and percentage of population with at least ged/equivalency education in the United States with a correlation coefficient (R) of -0.195 and weighted average of 77.9%. Similarly, the statistical analysis conducted on geographies consisting of 261,353,399 people shows a moderate positive correlation between the proportion of Slovenes and percentage of population with at least ged/equivalency education in the United States with a correlation coefficient (R) of 0.405 and weighted average of 88.8%, a difference of 13.9%.
Immigrants from Yemen vs Slovene GED/Equivalency

GED/Equivalency Correlation Summary

MeasurementImmigrants from YemenSlovene
Minimum39.4%79.6%
Maximum93.1%100.0%
Range53.7%20.4%
Mean73.9%90.9%
Median77.0%90.8%
Interquartile 25% (IQ1)67.7%88.4%
Interquartile 75% (IQ3)81.8%92.5%
Interquartile Range (IQR)14.1%4.1%
Standard Deviation (Sample)12.0%3.9%
Standard Deviation (Population)11.9%3.9%

Similar Demographics by GED/Equivalency

Demographics Similar to Immigrants from Yemen by GED/Equivalency

In terms of ged/equivalency, the demographic groups most similar to Immigrants from Yemen are Immigrants from Guatemala (77.9%, a difference of 0.020%), Immigrants from Dominican Republic (78.0%, a difference of 0.060%), Immigrants from El Salvador (77.6%, a difference of 0.41%), Tohono O'odham (77.5%, a difference of 0.56%), and Mexican (77.4%, a difference of 0.65%).
DemographicsRating | RankGED/Equivalency
Immigrants | Cabo Verde
0.0
/100
|
#330
Tragic
78.9%
Immigrants | Honduras
0.0
/100
|
#331
Tragic
78.7%
Immigrants | Azores
0.0
/100
|
#332
Tragic
78.7%
Salvadorans
0.0
/100
|
#333
Tragic
78.6%
Guatemalans
0.0
/100
|
#334
Tragic
78.5%
Immigrants | Latin America
0.0
/100
|
#335
Tragic
78.5%
Immigrants | Dominican Republic
0.0
/100
|
#336
Tragic
78.0%
Immigrants | Yemen
0.0
/100
|
#337
Tragic
77.9%
Immigrants | Guatemala
0.0
/100
|
#338
Tragic
77.9%
Immigrants | El Salvador
0.0
/100
|
#339
Tragic
77.6%
Tohono O'odham
0.0
/100
|
#340
Tragic
77.5%
Mexicans
0.0
/100
|
#341
Tragic
77.4%
Pima
0.0
/100
|
#342
Tragic
76.4%
Immigrants | Central America
0.0
/100
|
#343
Tragic
76.4%
Spanish American Indians
0.0
/100
|
#344
Tragic
76.3%

Demographics Similar to Slovenes by GED/Equivalency

In terms of ged/equivalency, the demographic groups most similar to Slovenes are Croatian (88.8%, a difference of 0.030%), Swedish (88.8%, a difference of 0.050%), Immigrants from Taiwan (88.8%, a difference of 0.060%), Okinawan (88.9%, a difference of 0.090%), and Cypriot (88.9%, a difference of 0.11%).
DemographicsRating | RankGED/Equivalency
Bulgarians
99.9
/100
|
#11
Exceptional
89.0%
Lithuanians
99.9
/100
|
#12
Exceptional
88.9%
Immigrants | Iran
99.9
/100
|
#13
Exceptional
88.9%
Cypriots
99.9
/100
|
#14
Exceptional
88.9%
Okinawans
99.9
/100
|
#15
Exceptional
88.9%
Immigrants | Taiwan
99.9
/100
|
#16
Exceptional
88.8%
Croatians
99.9
/100
|
#17
Exceptional
88.8%
Slovenes
99.9
/100
|
#18
Exceptional
88.8%
Swedes
99.9
/100
|
#19
Exceptional
88.8%
Maltese
99.9
/100
|
#20
Exceptional
88.6%
Luxembourgers
99.8
/100
|
#21
Exceptional
88.6%
Immigrants | Ireland
99.8
/100
|
#22
Exceptional
88.6%
Russians
99.8
/100
|
#23
Exceptional
88.6%
Slovaks
99.8
/100
|
#24
Exceptional
88.6%
Estonians
99.8
/100
|
#25
Exceptional
88.6%