Immigrants from Taiwan vs Iraqi Bachelor's Degree
COMPARE
Immigrants from Taiwan
Iraqi
Bachelor's Degree
Bachelor's Degree Comparison
Immigrants from Taiwan
Iraqis
51.2%
BACHELOR'S DEGREE
100.0/ 100
METRIC RATING
4th/ 347
METRIC RANK
39.0%
BACHELOR'S DEGREE
78.1/ 100
METRIC RATING
148th/ 347
METRIC RANK
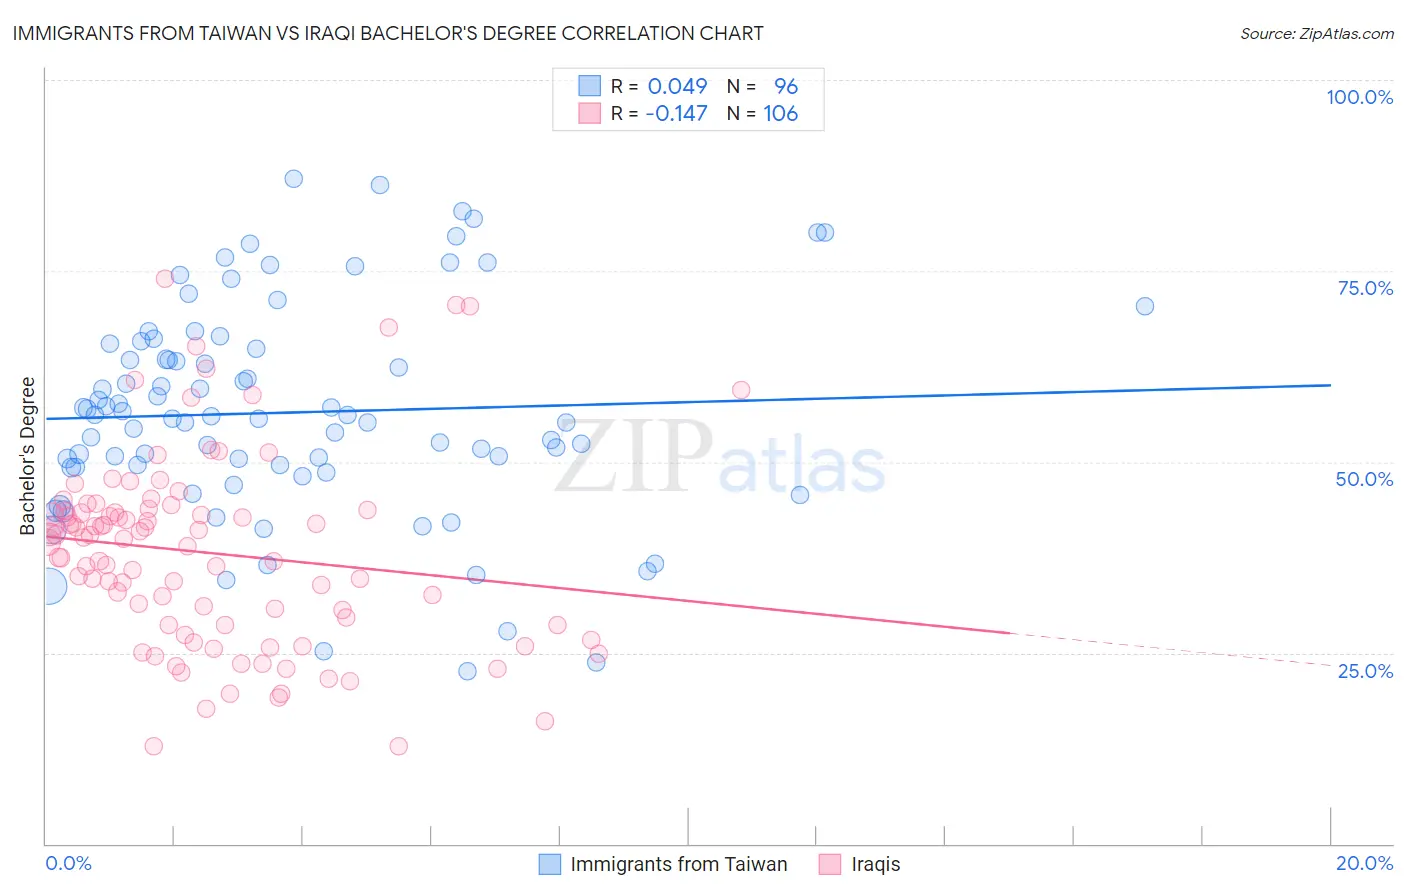
Immigrants from Taiwan vs Iraqi Bachelor's Degree Correlation Chart
The statistical analysis conducted on geographies consisting of 298,272,482 people shows no correlation between the proportion of Immigrants from Taiwan and percentage of population with at least bachelor's degree education in the United States with a correlation coefficient (R) of 0.049 and weighted average of 51.2%. Similarly, the statistical analysis conducted on geographies consisting of 170,654,288 people shows a poor negative correlation between the proportion of Iraqis and percentage of population with at least bachelor's degree education in the United States with a correlation coefficient (R) of -0.147 and weighted average of 39.0%, a difference of 31.3%.
Bachelor's Degree Correlation Summary
| Measurement | Immigrants from Taiwan | Iraqi |
| Minimum | 22.6% | 12.8% |
| Maximum | 87.1% | 74.1% |
| Range | 64.5% | 61.3% |
| Mean | 56.5% | 38.1% |
| Median | 55.9% | 39.7% |
| Interquartile 25% (IQ1) | 49.3% | 28.6% |
| Interquartile 75% (IQ3) | 65.1% | 43.6% |
| Interquartile Range (IQR) | 15.9% | 15.0% |
| Standard Deviation (Sample) | 14.1% | 12.6% |
| Standard Deviation (Population) | 14.0% | 12.5% |
Similar Demographics by Bachelor's Degree
Demographics Similar to Immigrants from Taiwan by Bachelor's Degree
In terms of bachelor's degree, the demographic groups most similar to Immigrants from Taiwan are Immigrants from India (51.3%, a difference of 0.21%), Iranian (51.0%, a difference of 0.42%), Okinawan (50.5%, a difference of 1.3%), Immigrants from Singapore (51.9%, a difference of 1.4%), and Immigrants from Iran (50.3%, a difference of 1.7%).
| Demographics | Rating | Rank | Bachelor's Degree |
| Filipinos | 100.0 /100 | #1 | Exceptional 52.7% |
| Immigrants | Singapore | 100.0 /100 | #2 | Exceptional 51.9% |
| Immigrants | India | 100.0 /100 | #3 | Exceptional 51.3% |
| Immigrants | Taiwan | 100.0 /100 | #4 | Exceptional 51.2% |
| Iranians | 100.0 /100 | #5 | Exceptional 51.0% |
| Okinawans | 100.0 /100 | #6 | Exceptional 50.5% |
| Immigrants | Iran | 100.0 /100 | #7 | Exceptional 50.3% |
| Thais | 100.0 /100 | #8 | Exceptional 50.1% |
| Immigrants | Israel | 100.0 /100 | #9 | Exceptional 50.0% |
| Cypriots | 100.0 /100 | #10 | Exceptional 49.0% |
| Immigrants | Australia | 100.0 /100 | #11 | Exceptional 48.5% |
| Immigrants | China | 100.0 /100 | #12 | Exceptional 48.4% |
| Immigrants | South Central Asia | 100.0 /100 | #13 | Exceptional 48.3% |
| Immigrants | Hong Kong | 100.0 /100 | #14 | Exceptional 48.2% |
| Immigrants | Eastern Asia | 100.0 /100 | #15 | Exceptional 48.1% |
Demographics Similar to Iraqis by Bachelor's Degree
In terms of bachelor's degree, the demographic groups most similar to Iraqis are Immigrants from Poland (39.0%, a difference of 0.080%), South American (38.9%, a difference of 0.11%), Immigrants from Sierra Leone (39.0%, a difference of 0.14%), Swedish (39.1%, a difference of 0.17%), and Slovene (39.1%, a difference of 0.21%).
| Demographics | Rating | Rank | Bachelor's Degree |
| South American Indians | 83.6 /100 | #141 | Excellent 39.3% |
| Immigrants | North Macedonia | 81.6 /100 | #142 | Excellent 39.2% |
| Poles | 79.8 /100 | #143 | Good 39.1% |
| Immigrants | Afghanistan | 79.7 /100 | #144 | Good 39.1% |
| Slovenes | 79.5 /100 | #145 | Good 39.1% |
| Swedes | 79.2 /100 | #146 | Good 39.1% |
| Immigrants | Sierra Leone | 79.0 /100 | #147 | Good 39.0% |
| Iraqis | 78.1 /100 | #148 | Good 39.0% |
| Immigrants | Poland | 77.5 /100 | #149 | Good 39.0% |
| South Americans | 77.3 /100 | #150 | Good 38.9% |
| Immigrants | Africa | 76.5 /100 | #151 | Good 38.9% |
| Sudanese | 76.4 /100 | #152 | Good 38.9% |
| Slavs | 75.9 /100 | #153 | Good 38.9% |
| Canadians | 75.0 /100 | #154 | Good 38.8% |
| Immigrants | Kenya | 73.8 /100 | #155 | Good 38.8% |