Shoshone vs Iraqi Bachelor's Degree
COMPARE
Shoshone
Iraqi
Bachelor's Degree
Bachelor's Degree Comparison
Shoshone
Iraqis
29.3%
BACHELOR'S DEGREE
0.0/ 100
METRIC RATING
314th/ 347
METRIC RANK
39.0%
BACHELOR'S DEGREE
78.1/ 100
METRIC RATING
148th/ 347
METRIC RANK
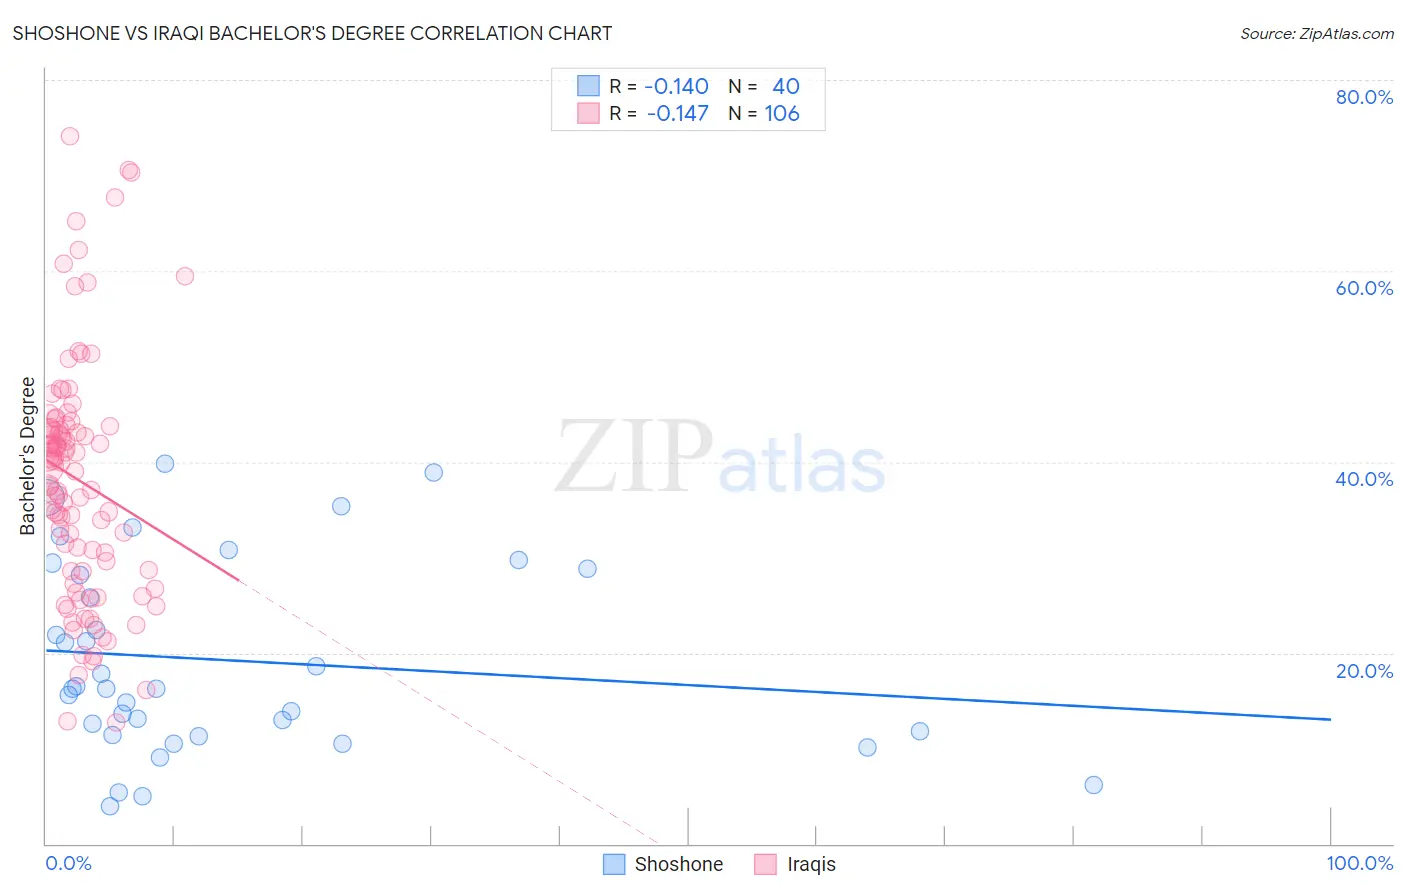
Shoshone vs Iraqi Bachelor's Degree Correlation Chart
The statistical analysis conducted on geographies consisting of 66,627,292 people shows a poor negative correlation between the proportion of Shoshone and percentage of population with at least bachelor's degree education in the United States with a correlation coefficient (R) of -0.140 and weighted average of 29.3%. Similarly, the statistical analysis conducted on geographies consisting of 170,654,288 people shows a poor negative correlation between the proportion of Iraqis and percentage of population with at least bachelor's degree education in the United States with a correlation coefficient (R) of -0.147 and weighted average of 39.0%, a difference of 33.2%.
Bachelor's Degree Correlation Summary
| Measurement | Shoshone | Iraqi |
| Minimum | 4.0% | 12.8% |
| Maximum | 39.8% | 74.1% |
| Range | 35.9% | 61.3% |
| Mean | 19.2% | 38.1% |
| Median | 16.3% | 39.7% |
| Interquartile 25% (IQ1) | 11.6% | 28.6% |
| Interquartile 75% (IQ3) | 28.4% | 43.6% |
| Interquartile Range (IQR) | 16.8% | 15.0% |
| Standard Deviation (Sample) | 10.0% | 12.6% |
| Standard Deviation (Population) | 9.8% | 12.5% |
Similar Demographics by Bachelor's Degree
Demographics Similar to Shoshone by Bachelor's Degree
In terms of bachelor's degree, the demographic groups most similar to Shoshone are Immigrants from Cabo Verde (29.2%, a difference of 0.080%), Alaska Native (29.4%, a difference of 0.29%), Seminole (29.4%, a difference of 0.48%), Choctaw (29.4%, a difference of 0.53%), and Cheyenne (29.4%, a difference of 0.60%).
| Demographics | Rating | Rank | Bachelor's Degree |
| Nepalese | 0.0 /100 | #307 | Tragic 29.9% |
| Cajuns | 0.0 /100 | #308 | Tragic 29.6% |
| Hispanics or Latinos | 0.0 /100 | #309 | Tragic 29.6% |
| Cheyenne | 0.0 /100 | #310 | Tragic 29.4% |
| Choctaw | 0.0 /100 | #311 | Tragic 29.4% |
| Seminole | 0.0 /100 | #312 | Tragic 29.4% |
| Alaska Natives | 0.0 /100 | #313 | Tragic 29.4% |
| Shoshone | 0.0 /100 | #314 | Tragic 29.3% |
| Immigrants | Cabo Verde | 0.0 /100 | #315 | Tragic 29.2% |
| Sioux | 0.0 /100 | #316 | Tragic 29.1% |
| Colville | 0.0 /100 | #317 | Tragic 29.0% |
| Yaqui | 0.0 /100 | #318 | Tragic 29.0% |
| Creek | 0.0 /100 | #319 | Tragic 28.9% |
| Kiowa | 0.0 /100 | #320 | Tragic 28.8% |
| Alaskan Athabascans | 0.0 /100 | #321 | Tragic 28.8% |
Demographics Similar to Iraqis by Bachelor's Degree
In terms of bachelor's degree, the demographic groups most similar to Iraqis are Immigrants from Poland (39.0%, a difference of 0.080%), South American (38.9%, a difference of 0.11%), Immigrants from Sierra Leone (39.0%, a difference of 0.14%), Swedish (39.1%, a difference of 0.17%), and Slovene (39.1%, a difference of 0.21%).
| Demographics | Rating | Rank | Bachelor's Degree |
| South American Indians | 83.6 /100 | #141 | Excellent 39.3% |
| Immigrants | North Macedonia | 81.6 /100 | #142 | Excellent 39.2% |
| Poles | 79.8 /100 | #143 | Good 39.1% |
| Immigrants | Afghanistan | 79.7 /100 | #144 | Good 39.1% |
| Slovenes | 79.5 /100 | #145 | Good 39.1% |
| Swedes | 79.2 /100 | #146 | Good 39.1% |
| Immigrants | Sierra Leone | 79.0 /100 | #147 | Good 39.0% |
| Iraqis | 78.1 /100 | #148 | Good 39.0% |
| Immigrants | Poland | 77.5 /100 | #149 | Good 39.0% |
| South Americans | 77.3 /100 | #150 | Good 38.9% |
| Immigrants | Africa | 76.5 /100 | #151 | Good 38.9% |
| Sudanese | 76.4 /100 | #152 | Good 38.9% |
| Slavs | 75.9 /100 | #153 | Good 38.9% |
| Canadians | 75.0 /100 | #154 | Good 38.8% |
| Immigrants | Kenya | 73.8 /100 | #155 | Good 38.8% |