Immigrants from Switzerland vs Immigrants from Eastern Africa Doctorate Degree
COMPARE
Immigrants from Switzerland
Immigrants from Eastern Africa
Doctorate Degree
Doctorate Degree Comparison
Immigrants from Switzerland
Immigrants from Eastern Africa
3.1%
DOCTORATE DEGREE
100.0/ 100
METRIC RATING
6th/ 347
METRIC RANK
2.1%
DOCTORATE DEGREE
98.2/ 100
METRIC RATING
101st/ 347
METRIC RANK
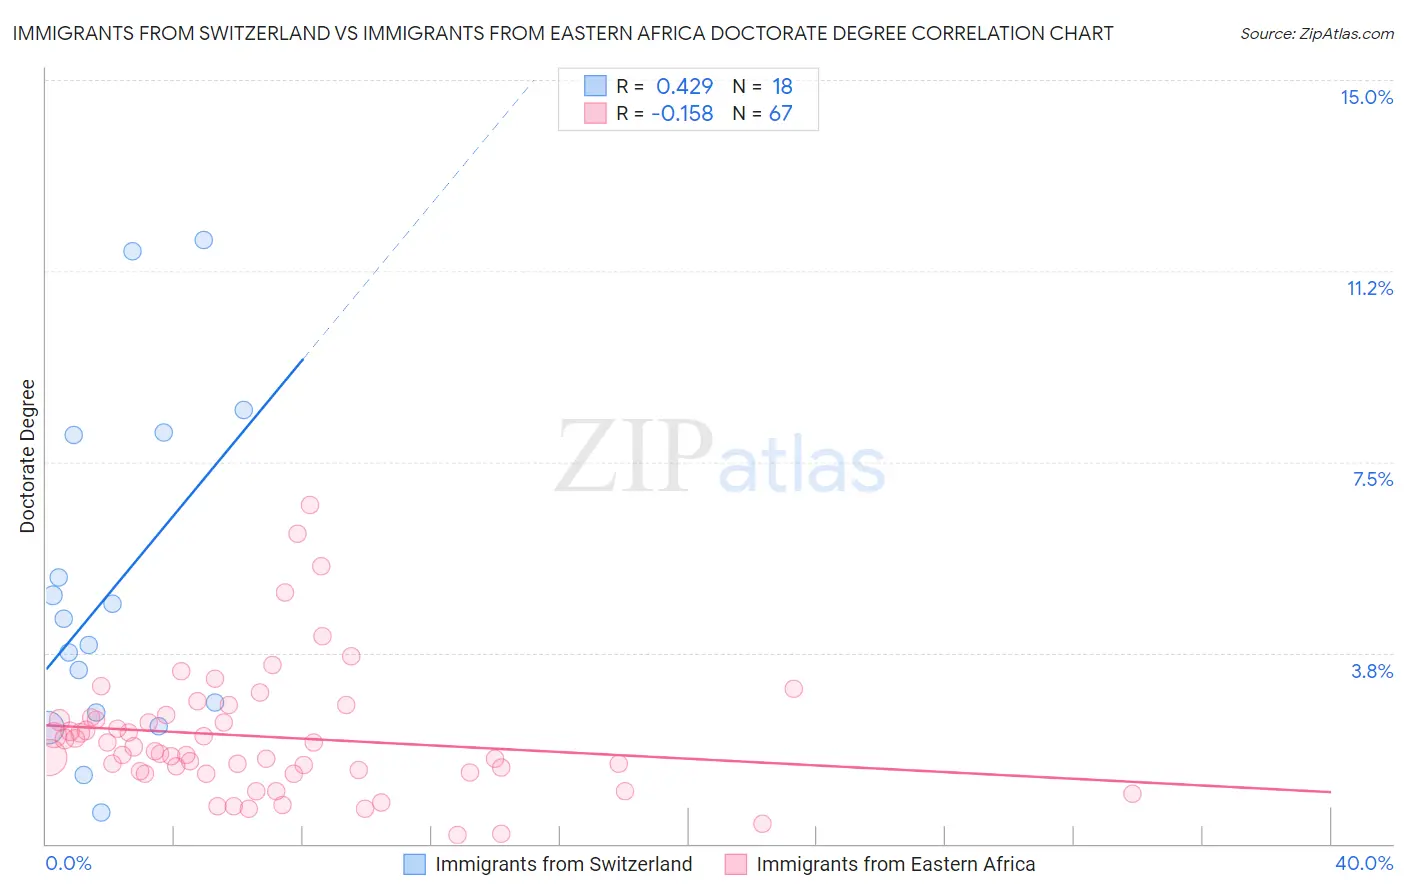
Immigrants from Switzerland vs Immigrants from Eastern Africa Doctorate Degree Correlation Chart
The statistical analysis conducted on geographies consisting of 147,873,421 people shows a moderate positive correlation between the proportion of Immigrants from Switzerland and percentage of population with at least doctorate degree education in the United States with a correlation coefficient (R) of 0.429 and weighted average of 3.1%. Similarly, the statistical analysis conducted on geographies consisting of 352,967,141 people shows a poor negative correlation between the proportion of Immigrants from Eastern Africa and percentage of population with at least doctorate degree education in the United States with a correlation coefficient (R) of -0.158 and weighted average of 2.1%, a difference of 46.5%.
Doctorate Degree Correlation Summary
| Measurement | Immigrants from Switzerland | Immigrants from Eastern Africa |
| Minimum | 0.62% | 0.18% |
| Maximum | 11.8% | 6.7% |
| Range | 11.2% | 6.5% |
| Mean | 5.0% | 2.1% |
| Median | 4.2% | 1.8% |
| Interquartile 25% (IQ1) | 2.6% | 1.4% |
| Interquartile 75% (IQ3) | 8.0% | 2.5% |
| Interquartile Range (IQR) | 5.5% | 1.1% |
| Standard Deviation (Sample) | 3.3% | 1.3% |
| Standard Deviation (Population) | 3.2% | 1.2% |
Similar Demographics by Doctorate Degree
Demographics Similar to Immigrants from Switzerland by Doctorate Degree
In terms of doctorate degree, the demographic groups most similar to Immigrants from Switzerland are Immigrants from China (3.1%, a difference of 0.070%), Immigrants from Israel (3.0%, a difference of 1.4%), Iranian (3.1%, a difference of 1.9%), Immigrants from Iran (3.0%, a difference of 2.1%), and Immigrants from Taiwan (3.2%, a difference of 3.5%).
| Demographics | Rating | Rank | Doctorate Degree |
| Immigrants | Singapore | 100.0 /100 | #1 | Exceptional 3.7% |
| Filipinos | 100.0 /100 | #2 | Exceptional 3.4% |
| Okinawans | 100.0 /100 | #3 | Exceptional 3.3% |
| Immigrants | Taiwan | 100.0 /100 | #4 | Exceptional 3.2% |
| Iranians | 100.0 /100 | #5 | Exceptional 3.1% |
| Immigrants | Switzerland | 100.0 /100 | #6 | Exceptional 3.1% |
| Immigrants | China | 100.0 /100 | #7 | Exceptional 3.1% |
| Immigrants | Israel | 100.0 /100 | #8 | Exceptional 3.0% |
| Immigrants | Iran | 100.0 /100 | #9 | Exceptional 3.0% |
| Immigrants | Eastern Asia | 100.0 /100 | #10 | Exceptional 3.0% |
| Indians (Asian) | 100.0 /100 | #11 | Exceptional 2.9% |
| Immigrants | Belgium | 100.0 /100 | #12 | Exceptional 2.9% |
| Immigrants | Sweden | 100.0 /100 | #13 | Exceptional 2.9% |
| Immigrants | France | 100.0 /100 | #14 | Exceptional 2.9% |
| Immigrants | India | 100.0 /100 | #15 | Exceptional 2.8% |
Demographics Similar to Immigrants from Eastern Africa by Doctorate Degree
In terms of doctorate degree, the demographic groups most similar to Immigrants from Eastern Africa are Immigrants from Egypt (2.1%, a difference of 0.030%), Immigrants from Eastern Europe (2.1%, a difference of 0.030%), Armenian (2.1%, a difference of 0.21%), Immigrants from Chile (2.1%, a difference of 0.22%), and Romanian (2.1%, a difference of 0.23%).
| Demographics | Rating | Rank | Doctorate Degree |
| Greeks | 98.8 /100 | #94 | Exceptional 2.1% |
| Immigrants | Romania | 98.7 /100 | #95 | Exceptional 2.1% |
| Immigrants | Northern Africa | 98.4 /100 | #96 | Exceptional 2.1% |
| Immigrants | Eritrea | 98.4 /100 | #97 | Exceptional 2.1% |
| Armenians | 98.3 /100 | #98 | Exceptional 2.1% |
| Immigrants | Egypt | 98.2 /100 | #99 | Exceptional 2.1% |
| Immigrants | Eastern Europe | 98.2 /100 | #100 | Exceptional 2.1% |
| Immigrants | Eastern Africa | 98.2 /100 | #101 | Exceptional 2.1% |
| Immigrants | Chile | 98.1 /100 | #102 | Exceptional 2.1% |
| Romanians | 98.1 /100 | #103 | Exceptional 2.1% |
| Austrians | 98.0 /100 | #104 | Exceptional 2.1% |
| Arabs | 97.8 /100 | #105 | Exceptional 2.1% |
| Sudanese | 97.7 /100 | #106 | Exceptional 2.1% |
| Europeans | 97.5 /100 | #107 | Exceptional 2.1% |
| Immigrants | Germany | 97.3 /100 | #108 | Exceptional 2.1% |