Immigrants from Dominican Republic vs Immigrants from Eastern Africa Doctorate Degree
COMPARE
Immigrants from Dominican Republic
Immigrants from Eastern Africa
Doctorate Degree
Doctorate Degree Comparison
Immigrants from Dominican Republic
Immigrants from Eastern Africa
1.3%
DOCTORATE DEGREE
0.0/ 100
METRIC RATING
334th/ 347
METRIC RANK
2.1%
DOCTORATE DEGREE
98.2/ 100
METRIC RATING
101st/ 347
METRIC RANK
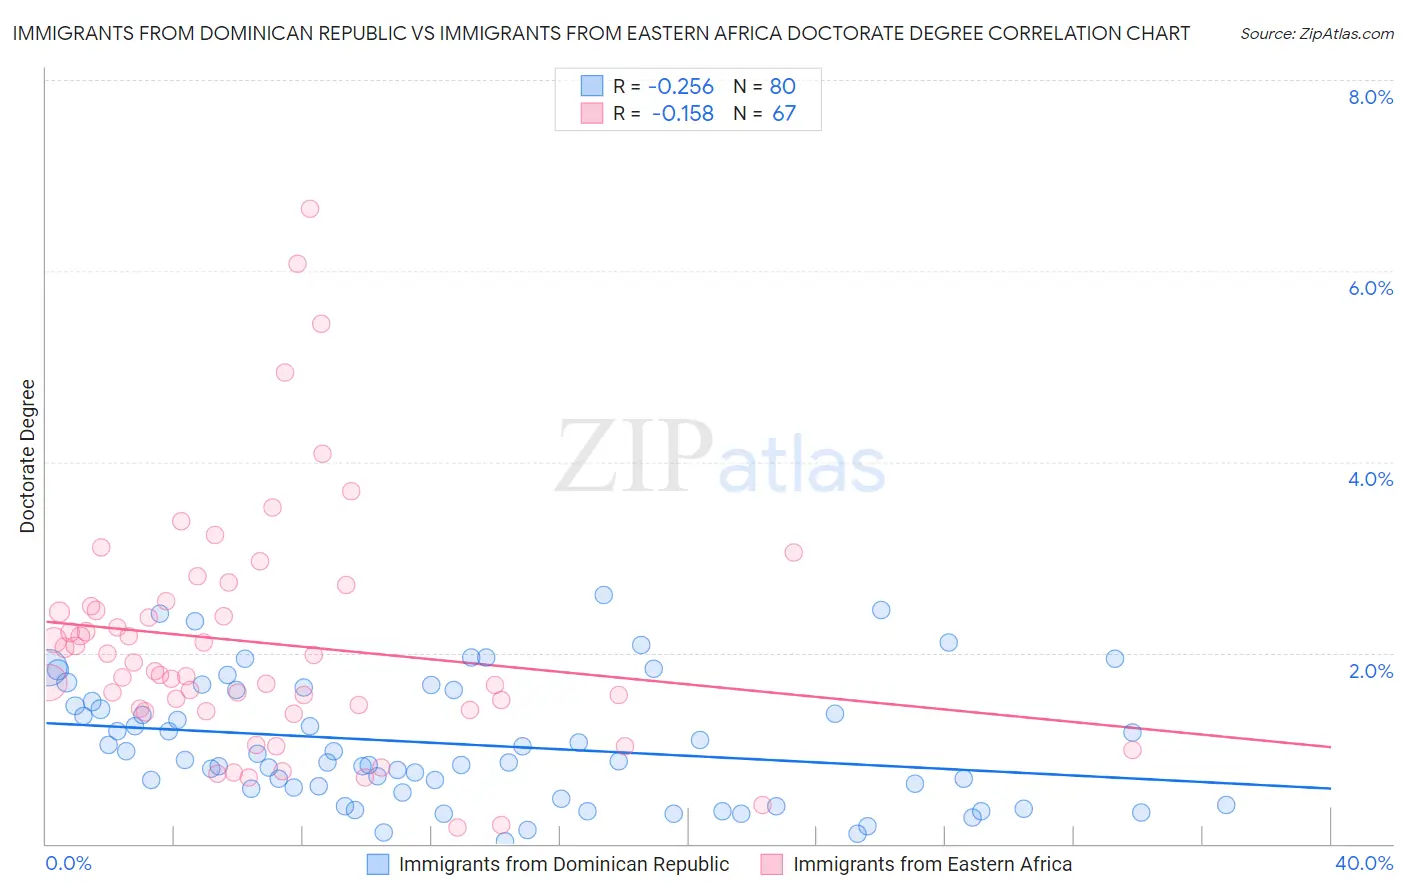
Immigrants from Dominican Republic vs Immigrants from Eastern Africa Doctorate Degree Correlation Chart
The statistical analysis conducted on geographies consisting of 273,260,616 people shows a weak negative correlation between the proportion of Immigrants from Dominican Republic and percentage of population with at least doctorate degree education in the United States with a correlation coefficient (R) of -0.256 and weighted average of 1.3%. Similarly, the statistical analysis conducted on geographies consisting of 352,967,141 people shows a poor negative correlation between the proportion of Immigrants from Eastern Africa and percentage of population with at least doctorate degree education in the United States with a correlation coefficient (R) of -0.158 and weighted average of 2.1%, a difference of 64.9%.
Doctorate Degree Correlation Summary
| Measurement | Immigrants from Dominican Republic | Immigrants from Eastern Africa |
| Minimum | 0.033% | 0.18% |
| Maximum | 2.6% | 6.7% |
| Range | 2.6% | 6.5% |
| Mean | 1.0% | 2.1% |
| Median | 0.87% | 1.8% |
| Interquartile 25% (IQ1) | 0.56% | 1.4% |
| Interquartile 75% (IQ3) | 1.5% | 2.5% |
| Interquartile Range (IQR) | 0.99% | 1.1% |
| Standard Deviation (Sample) | 0.64% | 1.3% |
| Standard Deviation (Population) | 0.64% | 1.2% |
Similar Demographics by Doctorate Degree
Demographics Similar to Immigrants from Dominican Republic by Doctorate Degree
In terms of doctorate degree, the demographic groups most similar to Immigrants from Dominican Republic are Immigrants from Caribbean (1.3%, a difference of 0.19%), Yakama (1.3%, a difference of 0.35%), Immigrants from Haiti (1.3%, a difference of 1.8%), Immigrants from Latin America (1.3%, a difference of 1.9%), and Yup'ik (1.3%, a difference of 1.9%).
| Demographics | Rating | Rank | Doctorate Degree |
| Hispanics or Latinos | 0.0 /100 | #327 | Tragic 1.3% |
| Inupiat | 0.0 /100 | #328 | Tragic 1.3% |
| Haitians | 0.0 /100 | #329 | Tragic 1.3% |
| Yup'ik | 0.0 /100 | #330 | Tragic 1.3% |
| Immigrants | Latin America | 0.0 /100 | #331 | Tragic 1.3% |
| Yakama | 0.0 /100 | #332 | Tragic 1.3% |
| Immigrants | Caribbean | 0.0 /100 | #333 | Tragic 1.3% |
| Immigrants | Dominican Republic | 0.0 /100 | #334 | Tragic 1.3% |
| Immigrants | Haiti | 0.0 /100 | #335 | Tragic 1.3% |
| Nepalese | 0.0 /100 | #336 | Tragic 1.3% |
| Bangladeshis | 0.0 /100 | #337 | Tragic 1.2% |
| Puget Sound Salish | 0.0 /100 | #338 | Tragic 1.2% |
| Immigrants | Central America | 0.0 /100 | #339 | Tragic 1.2% |
| Immigrants | Cuba | 0.0 /100 | #340 | Tragic 1.2% |
| Mexicans | 0.0 /100 | #341 | Tragic 1.2% |
Demographics Similar to Immigrants from Eastern Africa by Doctorate Degree
In terms of doctorate degree, the demographic groups most similar to Immigrants from Eastern Africa are Immigrants from Egypt (2.1%, a difference of 0.030%), Immigrants from Eastern Europe (2.1%, a difference of 0.030%), Armenian (2.1%, a difference of 0.21%), Immigrants from Chile (2.1%, a difference of 0.22%), and Romanian (2.1%, a difference of 0.23%).
| Demographics | Rating | Rank | Doctorate Degree |
| Greeks | 98.8 /100 | #94 | Exceptional 2.1% |
| Immigrants | Romania | 98.7 /100 | #95 | Exceptional 2.1% |
| Immigrants | Northern Africa | 98.4 /100 | #96 | Exceptional 2.1% |
| Immigrants | Eritrea | 98.4 /100 | #97 | Exceptional 2.1% |
| Armenians | 98.3 /100 | #98 | Exceptional 2.1% |
| Immigrants | Egypt | 98.2 /100 | #99 | Exceptional 2.1% |
| Immigrants | Eastern Europe | 98.2 /100 | #100 | Exceptional 2.1% |
| Immigrants | Eastern Africa | 98.2 /100 | #101 | Exceptional 2.1% |
| Immigrants | Chile | 98.1 /100 | #102 | Exceptional 2.1% |
| Romanians | 98.1 /100 | #103 | Exceptional 2.1% |
| Austrians | 98.0 /100 | #104 | Exceptional 2.1% |
| Arabs | 97.8 /100 | #105 | Exceptional 2.1% |
| Sudanese | 97.7 /100 | #106 | Exceptional 2.1% |
| Europeans | 97.5 /100 | #107 | Exceptional 2.1% |
| Immigrants | Germany | 97.3 /100 | #108 | Exceptional 2.1% |