Immigrants from Switzerland vs Immigrants from Eastern Africa Female Poverty
COMPARE
Immigrants from Switzerland
Immigrants from Eastern Africa
Female Poverty
Female Poverty Comparison
Immigrants from Switzerland
Immigrants from Eastern Africa
12.9%
FEMALE POVERTY
85.8/ 100
METRIC RATING
134th/ 347
METRIC RANK
14.2%
FEMALE POVERTY
9.0/ 100
METRIC RATING
207th/ 347
METRIC RANK
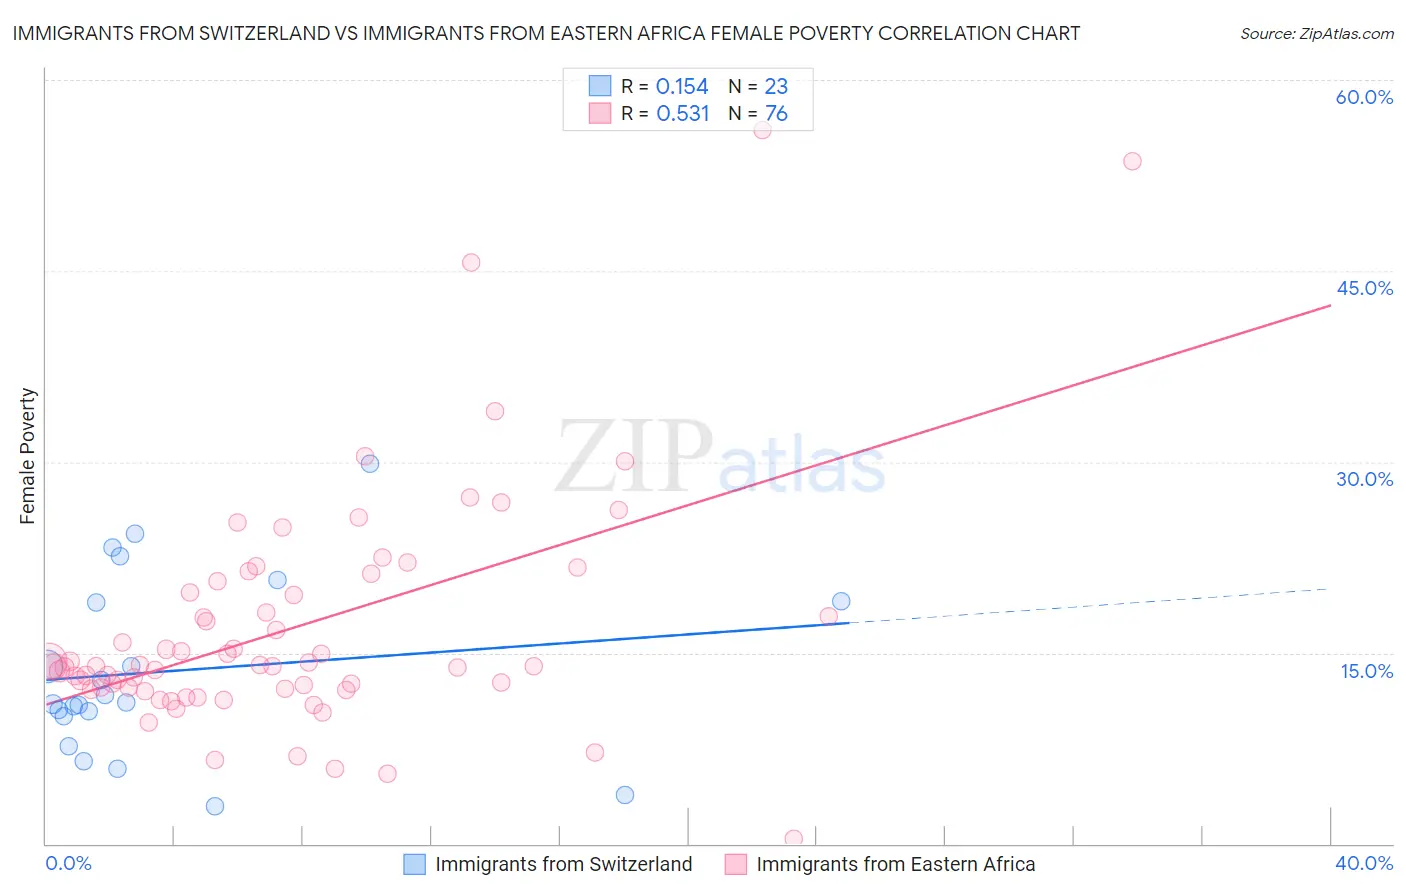
Immigrants from Switzerland vs Immigrants from Eastern Africa Female Poverty Correlation Chart
The statistical analysis conducted on geographies consisting of 148,048,454 people shows a poor positive correlation between the proportion of Immigrants from Switzerland and poverty level among females in the United States with a correlation coefficient (R) of 0.154 and weighted average of 12.9%. Similarly, the statistical analysis conducted on geographies consisting of 354,843,710 people shows a substantial positive correlation between the proportion of Immigrants from Eastern Africa and poverty level among females in the United States with a correlation coefficient (R) of 0.531 and weighted average of 14.2%, a difference of 10.3%.
Female Poverty Correlation Summary
| Measurement | Immigrants from Switzerland | Immigrants from Eastern Africa |
| Minimum | 2.9% | 0.38% |
| Maximum | 29.9% | 56.1% |
| Range | 27.0% | 55.7% |
| Mean | 13.6% | 17.0% |
| Median | 11.1% | 13.9% |
| Interquartile 25% (IQ1) | 10.0% | 12.2% |
| Interquartile 75% (IQ3) | 19.0% | 20.2% |
| Interquartile Range (IQR) | 9.0% | 8.0% |
| Standard Deviation (Sample) | 7.0% | 9.4% |
| Standard Deviation (Population) | 6.9% | 9.3% |
Similar Demographics by Female Poverty
Demographics Similar to Immigrants from Switzerland by Female Poverty
In terms of female poverty, the demographic groups most similar to Immigrants from Switzerland are French (12.9%, a difference of 0.050%), Peruvian (12.9%, a difference of 0.13%), Immigrants from Western Europe (12.8%, a difference of 0.16%), Immigrants from Jordan (12.8%, a difference of 0.22%), and Chilean (12.9%, a difference of 0.22%).
| Demographics | Rating | Rank | Female Poverty |
| South Africans | 88.4 /100 | #127 | Excellent 12.8% |
| Immigrants | Belarus | 88.2 /100 | #128 | Excellent 12.8% |
| Immigrants | Brazil | 87.9 /100 | #129 | Excellent 12.8% |
| Immigrants | Vietnam | 87.1 /100 | #130 | Excellent 12.8% |
| Immigrants | Argentina | 87.0 /100 | #131 | Excellent 12.8% |
| Immigrants | Jordan | 86.9 /100 | #132 | Excellent 12.8% |
| Immigrants | Western Europe | 86.6 /100 | #133 | Excellent 12.8% |
| Immigrants | Switzerland | 85.8 /100 | #134 | Excellent 12.9% |
| French | 85.6 /100 | #135 | Excellent 12.9% |
| Peruvians | 85.2 /100 | #136 | Excellent 12.9% |
| Chileans | 84.7 /100 | #137 | Excellent 12.9% |
| Immigrants | France | 83.6 /100 | #138 | Excellent 12.9% |
| Basques | 83.1 /100 | #139 | Excellent 12.9% |
| Pakistanis | 83.0 /100 | #140 | Excellent 12.9% |
| Icelanders | 81.1 /100 | #141 | Excellent 13.0% |
Demographics Similar to Immigrants from Eastern Africa by Female Poverty
In terms of female poverty, the demographic groups most similar to Immigrants from Eastern Africa are Immigrants from the Azores (14.2%, a difference of 0.34%), Panamanian (14.2%, a difference of 0.41%), Malaysian (14.3%, a difference of 0.49%), Moroccan (14.3%, a difference of 0.58%), and Immigrants from Uruguay (14.0%, a difference of 1.1%).
| Demographics | Rating | Rank | Female Poverty |
| Spanish | 21.4 /100 | #200 | Fair 13.9% |
| Immigrants | Kenya | 21.1 /100 | #201 | Fair 13.9% |
| Hmong | 21.1 /100 | #202 | Fair 13.9% |
| Immigrants | Western Asia | 20.7 /100 | #203 | Fair 13.9% |
| Spaniards | 18.9 /100 | #204 | Poor 13.9% |
| Ugandans | 15.4 /100 | #205 | Poor 14.0% |
| Immigrants | Uruguay | 14.0 /100 | #206 | Poor 14.0% |
| Immigrants | Eastern Africa | 9.0 /100 | #207 | Tragic 14.2% |
| Immigrants | Azores | 7.9 /100 | #208 | Tragic 14.2% |
| Panamanians | 7.7 /100 | #209 | Tragic 14.2% |
| Malaysians | 7.4 /100 | #210 | Tragic 14.3% |
| Moroccans | 7.2 /100 | #211 | Tragic 14.3% |
| Bermudans | 5.5 /100 | #212 | Tragic 14.4% |
| Alaskan Athabascans | 5.3 /100 | #213 | Tragic 14.4% |
| Marshallese | 5.0 /100 | #214 | Tragic 14.4% |