Immigrants from South Africa vs Sudanese 10th Grade
COMPARE
Immigrants from South Africa
Sudanese
10th Grade
10th Grade Comparison
Immigrants from South Africa
Sudanese
94.8%
10TH GRADE
99.5/ 100
METRIC RATING
77th/ 347
METRIC RANK
93.6%
10TH GRADE
36.6/ 100
METRIC RATING
185th/ 347
METRIC RANK
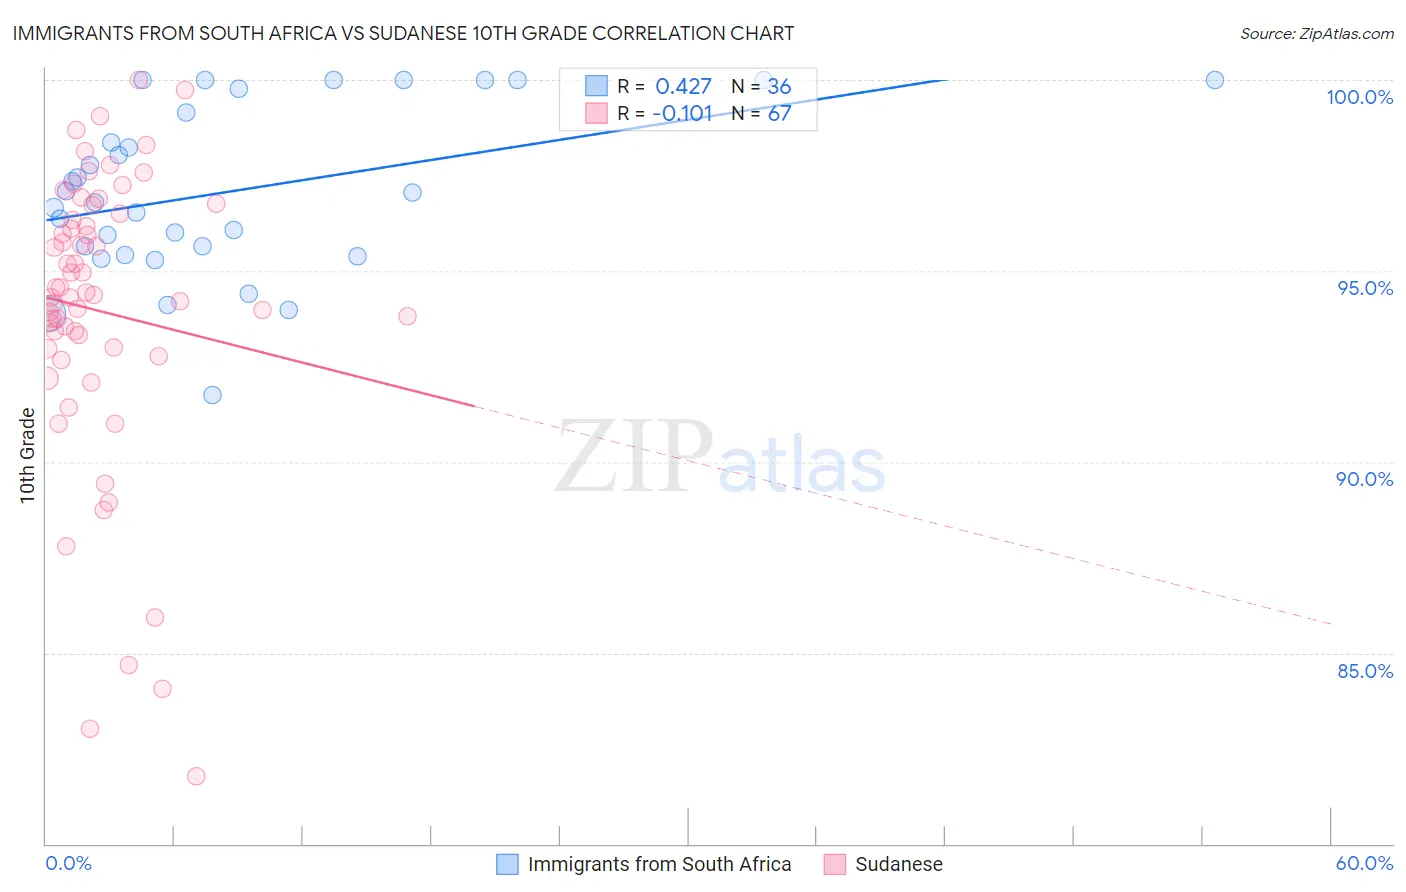
Immigrants from South Africa vs Sudanese 10th Grade Correlation Chart
The statistical analysis conducted on geographies consisting of 233,321,693 people shows a moderate positive correlation between the proportion of Immigrants from South Africa and percentage of population with at least 10th grade education in the United States with a correlation coefficient (R) of 0.427 and weighted average of 94.8%. Similarly, the statistical analysis conducted on geographies consisting of 110,134,719 people shows a poor negative correlation between the proportion of Sudanese and percentage of population with at least 10th grade education in the United States with a correlation coefficient (R) of -0.101 and weighted average of 93.6%, a difference of 1.3%.
10th Grade Correlation Summary
| Measurement | Immigrants from South Africa | Sudanese |
| Minimum | 91.8% | 81.8% |
| Maximum | 100.0% | 100.0% |
| Range | 8.2% | 18.2% |
| Mean | 97.1% | 93.9% |
| Median | 96.9% | 94.4% |
| Interquartile 25% (IQ1) | 95.5% | 93.0% |
| Interquartile 75% (IQ3) | 99.5% | 96.5% |
| Interquartile Range (IQR) | 3.9% | 3.5% |
| Standard Deviation (Sample) | 2.2% | 3.8% |
| Standard Deviation (Population) | 2.2% | 3.8% |
Similar Demographics by 10th Grade
Demographics Similar to Immigrants from South Africa by 10th Grade
In terms of 10th grade, the demographic groups most similar to Immigrants from South Africa are Romanian (94.8%, a difference of 0.0%), Okinawan (94.8%, a difference of 0.010%), Bhutanese (94.9%, a difference of 0.040%), Canadian (94.9%, a difference of 0.040%), and Immigrants from Sweden (94.9%, a difference of 0.050%).
| Demographics | Rating | Rank | 10th Grade |
| Zimbabweans | 99.6 /100 | #70 | Exceptional 94.9% |
| Alaska Natives | 99.6 /100 | #71 | Exceptional 94.9% |
| Immigrants | Sweden | 99.6 /100 | #72 | Exceptional 94.9% |
| Bhutanese | 99.6 /100 | #73 | Exceptional 94.9% |
| Canadians | 99.6 /100 | #74 | Exceptional 94.9% |
| Okinawans | 99.5 /100 | #75 | Exceptional 94.8% |
| Romanians | 99.5 /100 | #76 | Exceptional 94.8% |
| Immigrants | South Africa | 99.5 /100 | #77 | Exceptional 94.8% |
| Filipinos | 99.3 /100 | #78 | Exceptional 94.8% |
| Immigrants | Czechoslovakia | 99.2 /100 | #79 | Exceptional 94.7% |
| Immigrants | Denmark | 99.2 /100 | #80 | Exceptional 94.7% |
| Immigrants | Latvia | 99.2 /100 | #81 | Exceptional 94.7% |
| Swiss | 99.1 /100 | #82 | Exceptional 94.7% |
| Immigrants | Western Europe | 99.1 /100 | #83 | Exceptional 94.7% |
| Icelanders | 99.1 /100 | #84 | Exceptional 94.7% |
Demographics Similar to Sudanese by 10th Grade
In terms of 10th grade, the demographic groups most similar to Sudanese are Guamanian/Chamorro (93.6%, a difference of 0.0%), Choctaw (93.6%, a difference of 0.0%), Immigrants from Eastern Asia (93.6%, a difference of 0.010%), Colville (93.6%, a difference of 0.020%), and Liberian (93.6%, a difference of 0.020%).
| Demographics | Rating | Rank | 10th Grade |
| Sierra Leoneans | 46.1 /100 | #178 | Average 93.7% |
| Paraguayans | 45.3 /100 | #179 | Average 93.7% |
| Blackfeet | 42.8 /100 | #180 | Average 93.7% |
| Immigrants | Northern Africa | 41.6 /100 | #181 | Average 93.7% |
| Colville | 38.8 /100 | #182 | Fair 93.6% |
| Guamanians/Chamorros | 37.1 /100 | #183 | Fair 93.6% |
| Choctaw | 36.6 /100 | #184 | Fair 93.6% |
| Sudanese | 36.6 /100 | #185 | Fair 93.6% |
| Immigrants | Eastern Asia | 35.1 /100 | #186 | Fair 93.6% |
| Liberians | 34.7 /100 | #187 | Fair 93.6% |
| Marshallese | 33.2 /100 | #188 | Fair 93.6% |
| Immigrants | Pakistan | 32.5 /100 | #189 | Fair 93.6% |
| Laotians | 32.1 /100 | #190 | Fair 93.6% |
| Yup'ik | 31.1 /100 | #191 | Fair 93.6% |
| Immigrants | Malaysia | 28.0 /100 | #192 | Fair 93.5% |