Immigrants from Senegal vs Sudanese 10th Grade
COMPARE
Immigrants from Senegal
Sudanese
10th Grade
10th Grade Comparison
Immigrants from Senegal
Sudanese
92.8%
10TH GRADE
1.4/ 100
METRIC RATING
249th/ 347
METRIC RANK
93.6%
10TH GRADE
36.6/ 100
METRIC RATING
185th/ 347
METRIC RANK
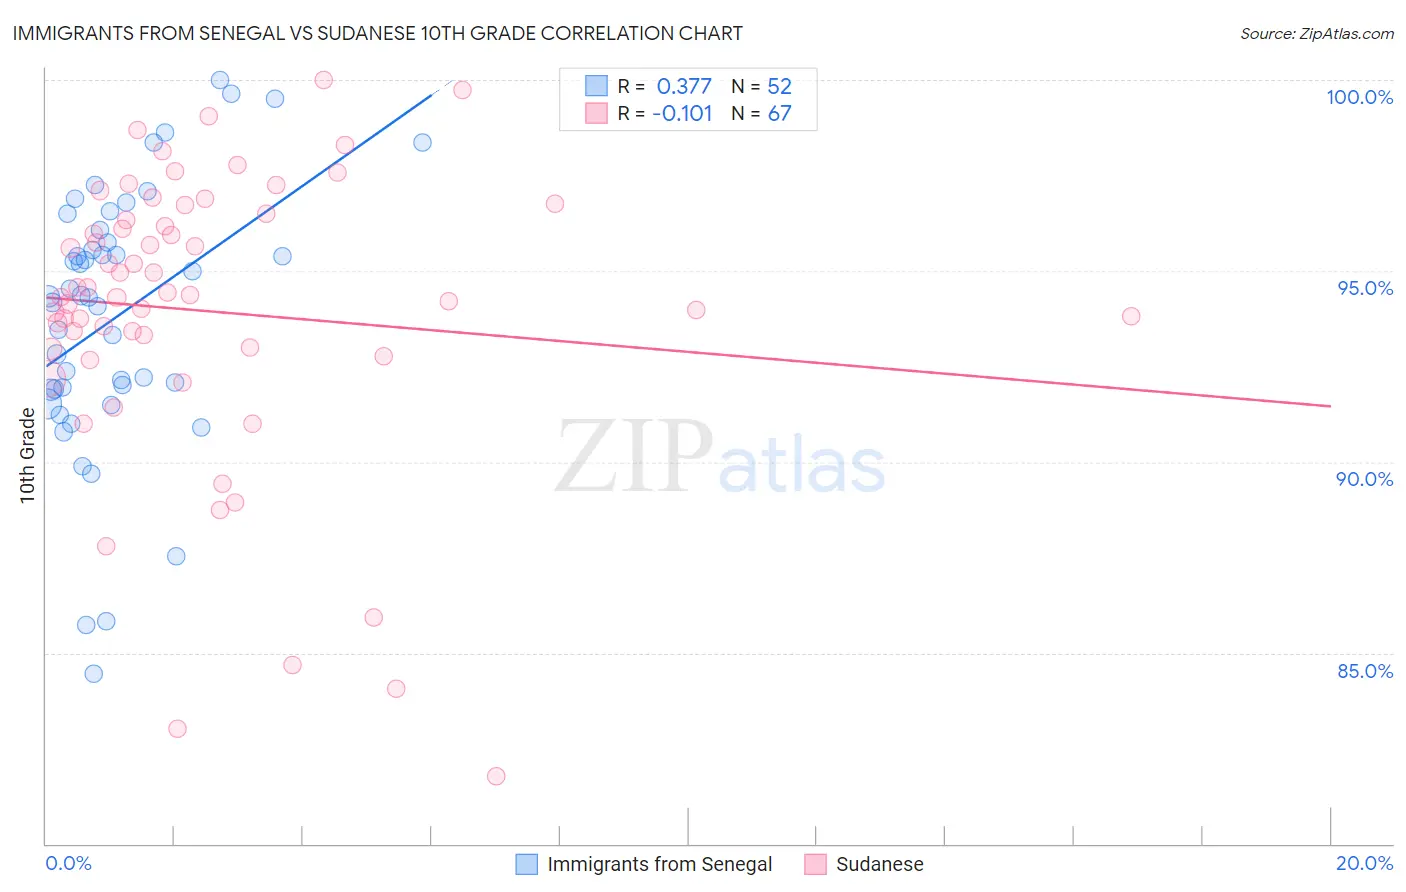
Immigrants from Senegal vs Sudanese 10th Grade Correlation Chart
The statistical analysis conducted on geographies consisting of 90,130,297 people shows a mild positive correlation between the proportion of Immigrants from Senegal and percentage of population with at least 10th grade education in the United States with a correlation coefficient (R) of 0.377 and weighted average of 92.8%. Similarly, the statistical analysis conducted on geographies consisting of 110,134,719 people shows a poor negative correlation between the proportion of Sudanese and percentage of population with at least 10th grade education in the United States with a correlation coefficient (R) of -0.101 and weighted average of 93.6%, a difference of 0.84%.
10th Grade Correlation Summary
| Measurement | Immigrants from Senegal | Sudanese |
| Minimum | 84.4% | 81.8% |
| Maximum | 100.0% | 100.0% |
| Range | 15.6% | 18.2% |
| Mean | 93.8% | 93.9% |
| Median | 94.3% | 94.4% |
| Interquartile 25% (IQ1) | 91.9% | 93.0% |
| Interquartile 75% (IQ3) | 95.9% | 96.5% |
| Interquartile Range (IQR) | 4.0% | 3.5% |
| Standard Deviation (Sample) | 3.5% | 3.8% |
| Standard Deviation (Population) | 3.4% | 3.8% |
Similar Demographics by 10th Grade
Demographics Similar to Immigrants from Senegal by 10th Grade
In terms of 10th grade, the demographic groups most similar to Immigrants from Senegal are Immigrants from Afghanistan (92.8%, a difference of 0.010%), Colombian (92.8%, a difference of 0.010%), Jamaican (92.8%, a difference of 0.020%), Immigrants from Middle Africa (92.9%, a difference of 0.050%), and Uruguayan (92.9%, a difference of 0.070%).
| Demographics | Rating | Rank | 10th Grade |
| Immigrants | Cameroon | 2.6 /100 | #242 | Tragic 93.0% |
| Senegalese | 2.4 /100 | #243 | Tragic 93.0% |
| Spanish Americans | 2.1 /100 | #244 | Tragic 92.9% |
| Uruguayans | 1.8 /100 | #245 | Tragic 92.9% |
| Immigrants | Middle Africa | 1.7 /100 | #246 | Tragic 92.9% |
| Immigrants | Afghanistan | 1.4 /100 | #247 | Tragic 92.8% |
| Colombians | 1.4 /100 | #248 | Tragic 92.8% |
| Immigrants | Senegal | 1.4 /100 | #249 | Tragic 92.8% |
| Jamaicans | 1.2 /100 | #250 | Tragic 92.8% |
| Immigrants | Thailand | 1.0 /100 | #251 | Tragic 92.8% |
| South Americans | 0.9 /100 | #252 | Tragic 92.8% |
| Ghanaians | 0.9 /100 | #253 | Tragic 92.8% |
| Armenians | 0.9 /100 | #254 | Tragic 92.7% |
| Immigrants | Bolivia | 0.7 /100 | #255 | Tragic 92.7% |
| Immigrants | Nigeria | 0.7 /100 | #256 | Tragic 92.7% |
Demographics Similar to Sudanese by 10th Grade
In terms of 10th grade, the demographic groups most similar to Sudanese are Guamanian/Chamorro (93.6%, a difference of 0.0%), Choctaw (93.6%, a difference of 0.0%), Immigrants from Eastern Asia (93.6%, a difference of 0.010%), Colville (93.6%, a difference of 0.020%), and Liberian (93.6%, a difference of 0.020%).
| Demographics | Rating | Rank | 10th Grade |
| Sierra Leoneans | 46.1 /100 | #178 | Average 93.7% |
| Paraguayans | 45.3 /100 | #179 | Average 93.7% |
| Blackfeet | 42.8 /100 | #180 | Average 93.7% |
| Immigrants | Northern Africa | 41.6 /100 | #181 | Average 93.7% |
| Colville | 38.8 /100 | #182 | Fair 93.6% |
| Guamanians/Chamorros | 37.1 /100 | #183 | Fair 93.6% |
| Choctaw | 36.6 /100 | #184 | Fair 93.6% |
| Sudanese | 36.6 /100 | #185 | Fair 93.6% |
| Immigrants | Eastern Asia | 35.1 /100 | #186 | Fair 93.6% |
| Liberians | 34.7 /100 | #187 | Fair 93.6% |
| Marshallese | 33.2 /100 | #188 | Fair 93.6% |
| Immigrants | Pakistan | 32.5 /100 | #189 | Fair 93.6% |
| Laotians | 32.1 /100 | #190 | Fair 93.6% |
| Yup'ik | 31.1 /100 | #191 | Fair 93.6% |
| Immigrants | Malaysia | 28.0 /100 | #192 | Fair 93.5% |