Immigrants from South Africa vs Choctaw GED/Equivalency
COMPARE
Immigrants from South Africa
Choctaw
GED/Equivalency
GED/Equivalency Comparison
Immigrants from South Africa
Choctaw
88.0%
GED/EQUIVALENCY
99.4/ 100
METRIC RATING
53rd/ 347
METRIC RANK
83.1%
GED/EQUIVALENCY
0.3/ 100
METRIC RATING
260th/ 347
METRIC RANK
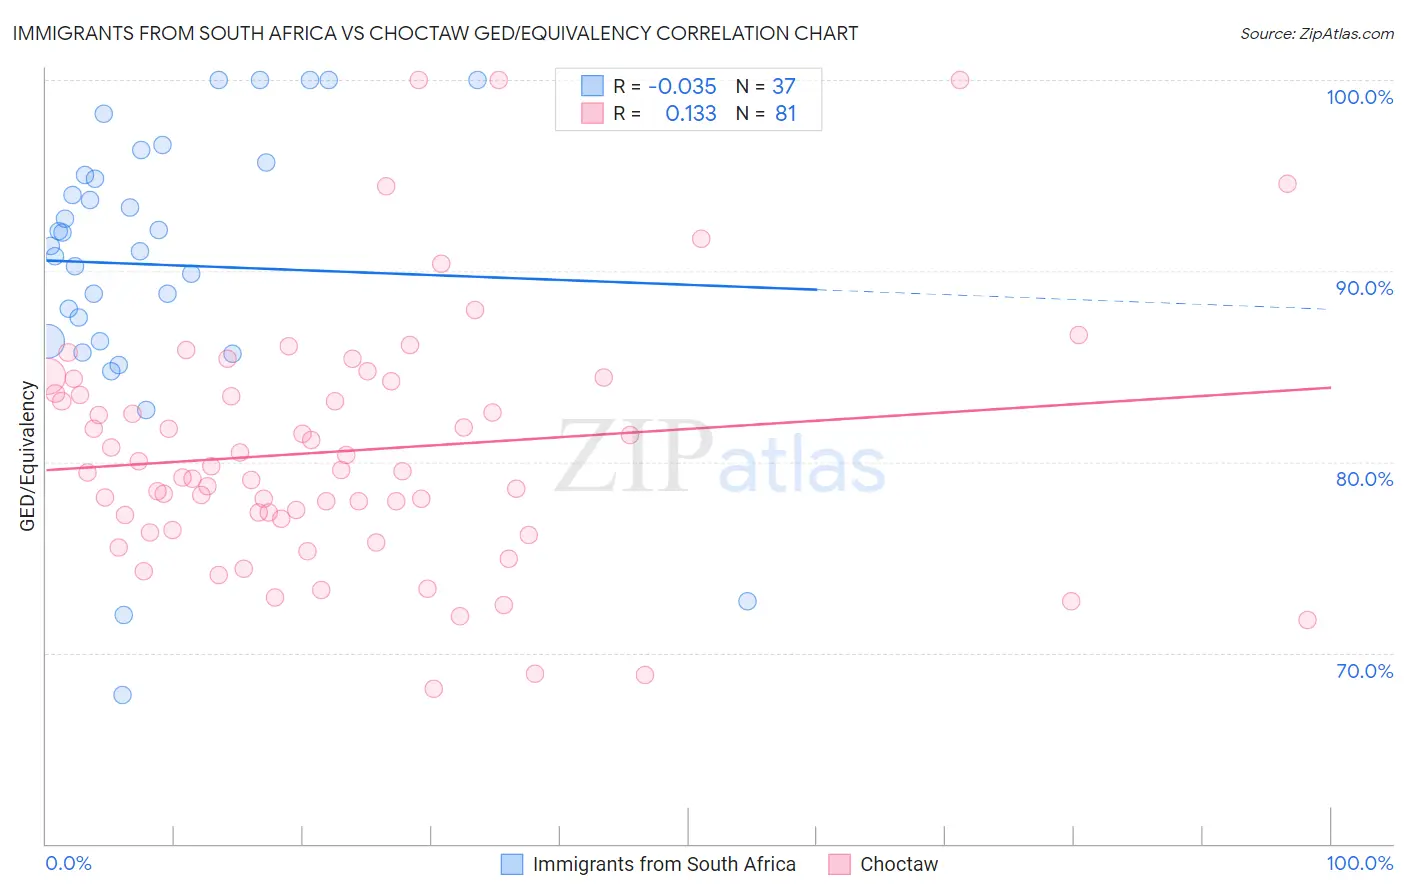
Immigrants from South Africa vs Choctaw GED/Equivalency Correlation Chart
The statistical analysis conducted on geographies consisting of 233,321,845 people shows no correlation between the proportion of Immigrants from South Africa and percentage of population with at least ged/equivalency education in the United States with a correlation coefficient (R) of -0.035 and weighted average of 88.0%. Similarly, the statistical analysis conducted on geographies consisting of 269,738,650 people shows a poor positive correlation between the proportion of Choctaw and percentage of population with at least ged/equivalency education in the United States with a correlation coefficient (R) of 0.133 and weighted average of 83.1%, a difference of 5.9%.
GED/Equivalency Correlation Summary
| Measurement | Immigrants from South Africa | Choctaw |
| Minimum | 67.8% | 68.1% |
| Maximum | 100.0% | 100.0% |
| Range | 32.2% | 31.9% |
| Mean | 90.3% | 80.6% |
| Median | 91.3% | 79.5% |
| Interquartile 25% (IQ1) | 86.3% | 76.7% |
| Interquartile 75% (IQ3) | 95.4% | 83.9% |
| Interquartile Range (IQR) | 9.0% | 7.2% |
| Standard Deviation (Sample) | 7.6% | 6.5% |
| Standard Deviation (Population) | 7.5% | 6.5% |
Similar Demographics by GED/Equivalency
Demographics Similar to Immigrants from South Africa by GED/Equivalency
In terms of ged/equivalency, the demographic groups most similar to Immigrants from South Africa are Immigrants from Netherlands (88.0%, a difference of 0.0%), Zimbabwean (88.0%, a difference of 0.0%), Soviet Union (88.0%, a difference of 0.010%), New Zealander (88.0%, a difference of 0.010%), and Immigrants from Denmark (88.0%, a difference of 0.030%).
| Demographics | Rating | Rank | GED/Equivalency |
| Immigrants | Switzerland | 99.5 /100 | #46 | Exceptional 88.1% |
| Immigrants | Latvia | 99.5 /100 | #47 | Exceptional 88.1% |
| Greeks | 99.5 /100 | #48 | Exceptional 88.1% |
| Australians | 99.5 /100 | #49 | Exceptional 88.1% |
| Immigrants | Korea | 99.5 /100 | #50 | Exceptional 88.1% |
| Immigrants | Netherlands | 99.4 /100 | #51 | Exceptional 88.0% |
| Zimbabweans | 99.4 /100 | #52 | Exceptional 88.0% |
| Immigrants | South Africa | 99.4 /100 | #53 | Exceptional 88.0% |
| Soviet Union | 99.4 /100 | #54 | Exceptional 88.0% |
| New Zealanders | 99.4 /100 | #55 | Exceptional 88.0% |
| Immigrants | Denmark | 99.4 /100 | #56 | Exceptional 88.0% |
| Immigrants | Czechoslovakia | 99.3 /100 | #57 | Exceptional 87.9% |
| Northern Europeans | 99.3 /100 | #58 | Exceptional 87.9% |
| Serbians | 99.3 /100 | #59 | Exceptional 87.9% |
| Scandinavians | 99.3 /100 | #60 | Exceptional 87.9% |
Demographics Similar to Choctaw by GED/Equivalency
In terms of ged/equivalency, the demographic groups most similar to Choctaw are Immigrants from Vietnam (83.2%, a difference of 0.030%), Inupiat (83.1%, a difference of 0.050%), Immigrants from Armenia (83.1%, a difference of 0.060%), Immigrants from Congo (83.1%, a difference of 0.070%), and Bangladeshi (83.1%, a difference of 0.080%).
| Demographics | Rating | Rank | GED/Equivalency |
| Comanche | 0.7 /100 | #253 | Tragic 83.6% |
| Creek | 0.7 /100 | #254 | Tragic 83.6% |
| Colville | 0.5 /100 | #255 | Tragic 83.4% |
| Africans | 0.5 /100 | #256 | Tragic 83.4% |
| Jamaicans | 0.4 /100 | #257 | Tragic 83.3% |
| Malaysians | 0.4 /100 | #258 | Tragic 83.3% |
| Immigrants | Vietnam | 0.3 /100 | #259 | Tragic 83.2% |
| Choctaw | 0.3 /100 | #260 | Tragic 83.1% |
| Inupiat | 0.2 /100 | #261 | Tragic 83.1% |
| Immigrants | Armenia | 0.2 /100 | #262 | Tragic 83.1% |
| Immigrants | Congo | 0.2 /100 | #263 | Tragic 83.1% |
| Bangladeshis | 0.2 /100 | #264 | Tragic 83.1% |
| West Indians | 0.2 /100 | #265 | Tragic 83.1% |
| Kiowa | 0.2 /100 | #266 | Tragic 83.1% |
| Trinidadians and Tobagonians | 0.2 /100 | #267 | Tragic 83.0% |