Immigrants from South Africa vs English GED/Equivalency
COMPARE
Immigrants from South Africa
English
GED/Equivalency
GED/Equivalency Comparison
Immigrants from South Africa
English
88.0%
GED/EQUIVALENCY
99.4/ 100
METRIC RATING
53rd/ 347
METRIC RANK
87.6%
GED/EQUIVALENCY
98.6/ 100
METRIC RATING
79th/ 347
METRIC RANK
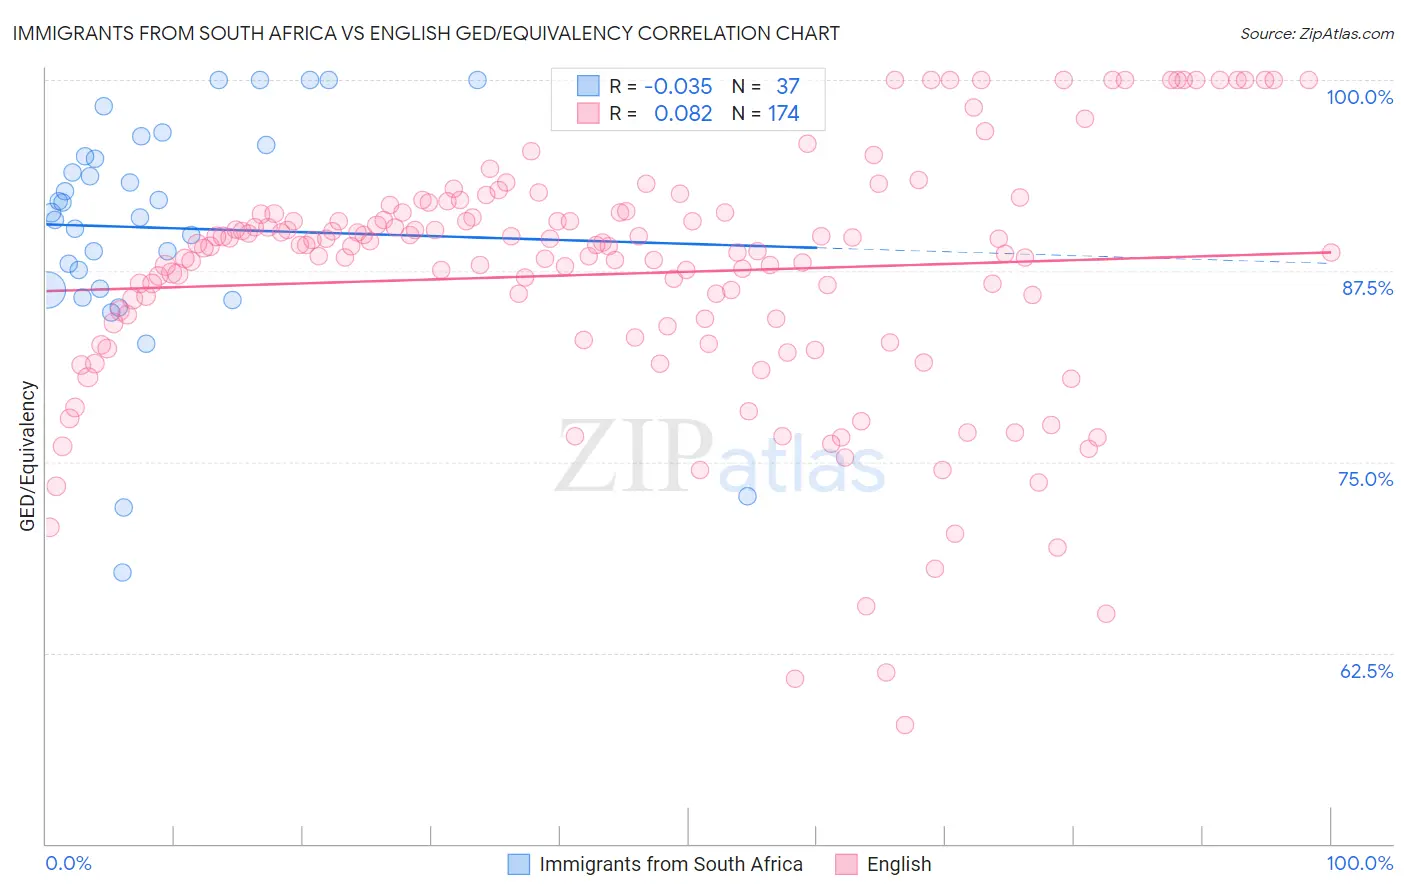
Immigrants from South Africa vs English GED/Equivalency Correlation Chart
The statistical analysis conducted on geographies consisting of 233,321,845 people shows no correlation between the proportion of Immigrants from South Africa and percentage of population with at least ged/equivalency education in the United States with a correlation coefficient (R) of -0.035 and weighted average of 88.0%. Similarly, the statistical analysis conducted on geographies consisting of 579,979,946 people shows a slight positive correlation between the proportion of English and percentage of population with at least ged/equivalency education in the United States with a correlation coefficient (R) of 0.082 and weighted average of 87.6%, a difference of 0.45%.
GED/Equivalency Correlation Summary
| Measurement | Immigrants from South Africa | English |
| Minimum | 67.8% | 57.8% |
| Maximum | 100.0% | 100.0% |
| Range | 32.2% | 42.2% |
| Mean | 90.3% | 87.3% |
| Median | 91.3% | 89.1% |
| Interquartile 25% (IQ1) | 86.3% | 83.9% |
| Interquartile 75% (IQ3) | 95.4% | 91.2% |
| Interquartile Range (IQR) | 9.0% | 7.3% |
| Standard Deviation (Sample) | 7.6% | 8.1% |
| Standard Deviation (Population) | 7.5% | 8.1% |
Similar Demographics by GED/Equivalency
Demographics Similar to Immigrants from South Africa by GED/Equivalency
In terms of ged/equivalency, the demographic groups most similar to Immigrants from South Africa are Immigrants from Netherlands (88.0%, a difference of 0.0%), Zimbabwean (88.0%, a difference of 0.0%), Soviet Union (88.0%, a difference of 0.010%), New Zealander (88.0%, a difference of 0.010%), and Immigrants from Denmark (88.0%, a difference of 0.030%).
| Demographics | Rating | Rank | GED/Equivalency |
| Immigrants | Switzerland | 99.5 /100 | #46 | Exceptional 88.1% |
| Immigrants | Latvia | 99.5 /100 | #47 | Exceptional 88.1% |
| Greeks | 99.5 /100 | #48 | Exceptional 88.1% |
| Australians | 99.5 /100 | #49 | Exceptional 88.1% |
| Immigrants | Korea | 99.5 /100 | #50 | Exceptional 88.1% |
| Immigrants | Netherlands | 99.4 /100 | #51 | Exceptional 88.0% |
| Zimbabweans | 99.4 /100 | #52 | Exceptional 88.0% |
| Immigrants | South Africa | 99.4 /100 | #53 | Exceptional 88.0% |
| Soviet Union | 99.4 /100 | #54 | Exceptional 88.0% |
| New Zealanders | 99.4 /100 | #55 | Exceptional 88.0% |
| Immigrants | Denmark | 99.4 /100 | #56 | Exceptional 88.0% |
| Immigrants | Czechoslovakia | 99.3 /100 | #57 | Exceptional 87.9% |
| Northern Europeans | 99.3 /100 | #58 | Exceptional 87.9% |
| Serbians | 99.3 /100 | #59 | Exceptional 87.9% |
| Scandinavians | 99.3 /100 | #60 | Exceptional 87.9% |
Demographics Similar to English by GED/Equivalency
In terms of ged/equivalency, the demographic groups most similar to English are Irish (87.6%, a difference of 0.030%), Immigrants from England (87.6%, a difference of 0.030%), Immigrants from Serbia (87.7%, a difference of 0.050%), Slavic (87.7%, a difference of 0.050%), and Scottish (87.7%, a difference of 0.070%).
| Demographics | Rating | Rank | GED/Equivalency |
| Immigrants | Moldova | 98.8 /100 | #72 | Exceptional 87.7% |
| Belgians | 98.8 /100 | #73 | Exceptional 87.7% |
| Immigrants | Kuwait | 98.8 /100 | #74 | Exceptional 87.7% |
| Scottish | 98.7 /100 | #75 | Exceptional 87.7% |
| Immigrants | Serbia | 98.7 /100 | #76 | Exceptional 87.7% |
| Slavs | 98.7 /100 | #77 | Exceptional 87.7% |
| Irish | 98.6 /100 | #78 | Exceptional 87.6% |
| English | 98.6 /100 | #79 | Exceptional 87.6% |
| Immigrants | England | 98.5 /100 | #80 | Exceptional 87.6% |
| Immigrants | Sri Lanka | 98.3 /100 | #81 | Exceptional 87.5% |
| Romanians | 98.3 /100 | #82 | Exceptional 87.5% |
| South Africans | 98.3 /100 | #83 | Exceptional 87.5% |
| Immigrants | Romania | 98.1 /100 | #84 | Exceptional 87.5% |
| Dutch | 98.1 /100 | #85 | Exceptional 87.5% |
| Immigrants | Europe | 98.1 /100 | #86 | Exceptional 87.5% |