Immigrants from Somalia vs Immigrants from Eritrea Master's Degree
COMPARE
Immigrants from Somalia
Immigrants from Eritrea
Master's Degree
Master's Degree Comparison
Immigrants from Somalia
Immigrants from Eritrea
14.1%
MASTER'S DEGREE
15.8/ 100
METRIC RATING
216th/ 347
METRIC RANK
16.4%
MASTER'S DEGREE
95.5/ 100
METRIC RATING
124th/ 347
METRIC RANK
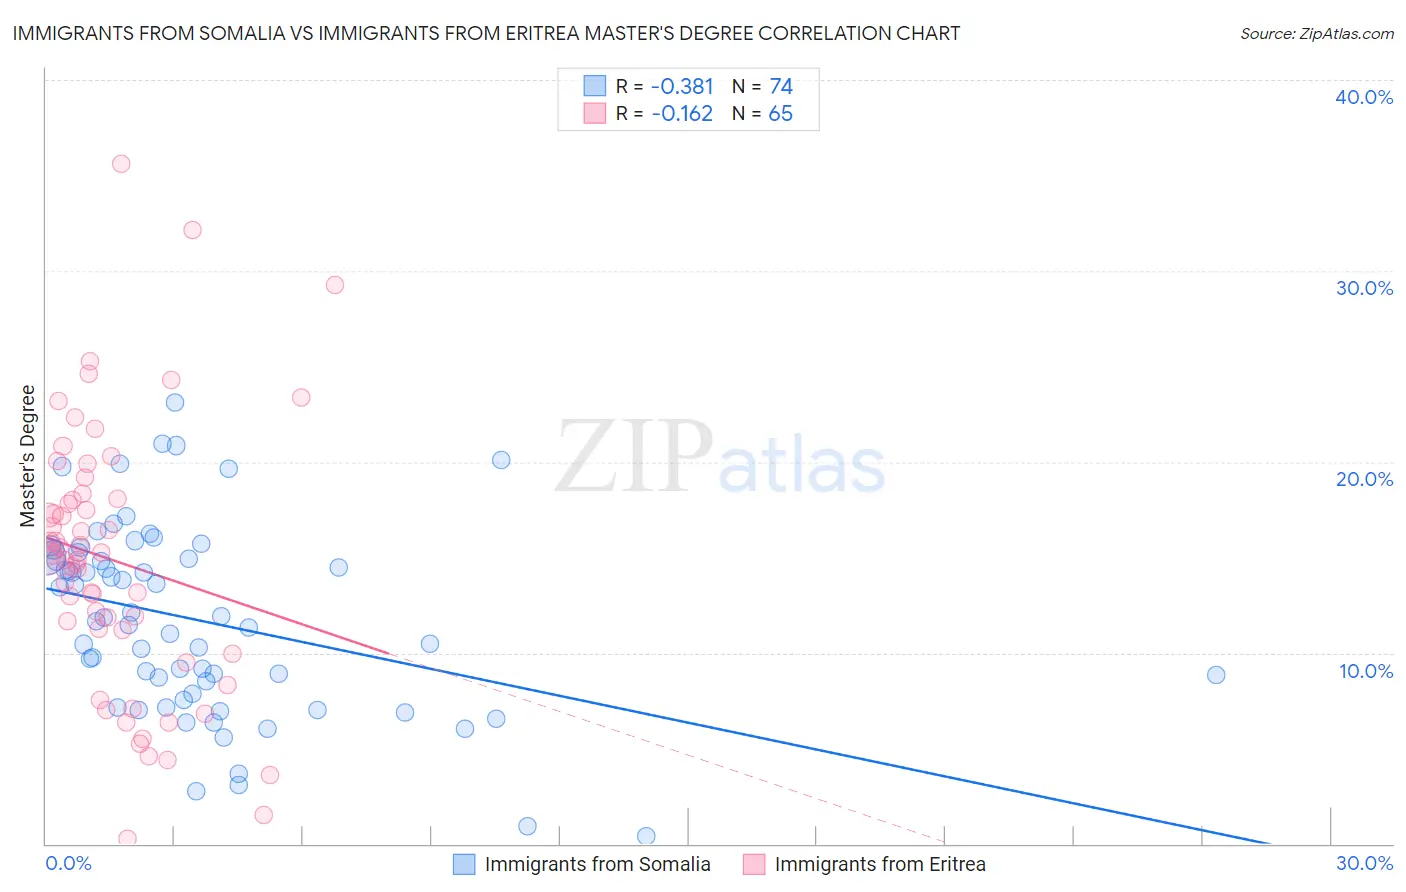
Immigrants from Somalia vs Immigrants from Eritrea Master's Degree Correlation Chart
The statistical analysis conducted on geographies consisting of 92,109,960 people shows a mild negative correlation between the proportion of Immigrants from Somalia and percentage of population with at least master's degree education in the United States with a correlation coefficient (R) of -0.381 and weighted average of 14.1%. Similarly, the statistical analysis conducted on geographies consisting of 104,847,630 people shows a poor negative correlation between the proportion of Immigrants from Eritrea and percentage of population with at least master's degree education in the United States with a correlation coefficient (R) of -0.162 and weighted average of 16.4%, a difference of 16.0%.
Master's Degree Correlation Summary
| Measurement | Immigrants from Somalia | Immigrants from Eritrea |
| Minimum | 0.40% | 0.25% |
| Maximum | 23.1% | 35.6% |
| Range | 22.7% | 35.4% |
| Mean | 11.7% | 14.8% |
| Median | 11.7% | 15.0% |
| Interquartile 25% (IQ1) | 7.9% | 10.6% |
| Interquartile 75% (IQ3) | 15.1% | 18.2% |
| Interquartile Range (IQR) | 7.2% | 7.6% |
| Standard Deviation (Sample) | 4.9% | 7.0% |
| Standard Deviation (Population) | 4.9% | 7.0% |
Similar Demographics by Master's Degree
Demographics Similar to Immigrants from Somalia by Master's Degree
In terms of master's degree, the demographic groups most similar to Immigrants from Somalia are Immigrants from Trinidad and Tobago (14.1%, a difference of 0.0%), Immigrants from Vietnam (14.1%, a difference of 0.070%), French Canadian (14.1%, a difference of 0.25%), Finnish (14.2%, a difference of 0.27%), and Immigrants from Thailand (14.2%, a difference of 0.29%).
| Demographics | Rating | Rank | Master's Degree |
| Immigrants | Panama | 20.0 /100 | #209 | Fair 14.3% |
| Sub-Saharan Africans | 19.4 /100 | #210 | Poor 14.2% |
| Somalis | 18.0 /100 | #211 | Poor 14.2% |
| Spanish | 17.8 /100 | #212 | Poor 14.2% |
| Immigrants | Thailand | 17.0 /100 | #213 | Poor 14.2% |
| Finns | 16.9 /100 | #214 | Poor 14.2% |
| Immigrants | Vietnam | 16.1 /100 | #215 | Poor 14.1% |
| Immigrants | Somalia | 15.8 /100 | #216 | Poor 14.1% |
| Immigrants | Trinidad and Tobago | 15.8 /100 | #217 | Poor 14.1% |
| French Canadians | 14.9 /100 | #218 | Poor 14.1% |
| Norwegians | 13.6 /100 | #219 | Poor 14.0% |
| Germans | 13.1 /100 | #220 | Poor 14.0% |
| Koreans | 12.7 /100 | #221 | Poor 14.0% |
| Ecuadorians | 12.6 /100 | #222 | Poor 14.0% |
| Immigrants | South Eastern Asia | 11.9 /100 | #223 | Poor 14.0% |
Demographics Similar to Immigrants from Eritrea by Master's Degree
In terms of master's degree, the demographic groups most similar to Immigrants from Eritrea are Croatian (16.4%, a difference of 0.070%), Italian (16.4%, a difference of 0.070%), British (16.4%, a difference of 0.080%), Immigrants from Eastern Africa (16.3%, a difference of 0.19%), and Palestinian (16.3%, a difference of 0.45%).
| Demographics | Rating | Rank | Master's Degree |
| Immigrants | Moldova | 97.2 /100 | #117 | Exceptional 16.6% |
| Brazilians | 96.8 /100 | #118 | Exceptional 16.5% |
| Jordanians | 96.5 /100 | #119 | Exceptional 16.5% |
| Lebanese | 96.4 /100 | #120 | Exceptional 16.5% |
| Afghans | 96.2 /100 | #121 | Exceptional 16.5% |
| British | 95.6 /100 | #122 | Exceptional 16.4% |
| Croatians | 95.6 /100 | #123 | Exceptional 16.4% |
| Immigrants | Eritrea | 95.5 /100 | #124 | Exceptional 16.4% |
| Italians | 95.4 /100 | #125 | Exceptional 16.4% |
| Immigrants | Eastern Africa | 95.2 /100 | #126 | Exceptional 16.3% |
| Palestinians | 94.8 /100 | #127 | Exceptional 16.3% |
| Immigrants | Sierra Leone | 94.7 /100 | #128 | Exceptional 16.3% |
| Immigrants | Syria | 93.3 /100 | #129 | Exceptional 16.2% |
| Immigrants | Jordan | 92.7 /100 | #130 | Exceptional 16.1% |
| Taiwanese | 91.9 /100 | #131 | Exceptional 16.1% |