Immigrants from Sierra Leone vs Ghanaian 10th Grade
COMPARE
Immigrants from Sierra Leone
Ghanaian
10th Grade
10th Grade Comparison
Immigrants from Sierra Leone
Ghanaians
93.2%
10TH GRADE
7.6/ 100
METRIC RATING
223rd/ 347
METRIC RANK
92.8%
10TH GRADE
0.9/ 100
METRIC RATING
253rd/ 347
METRIC RANK
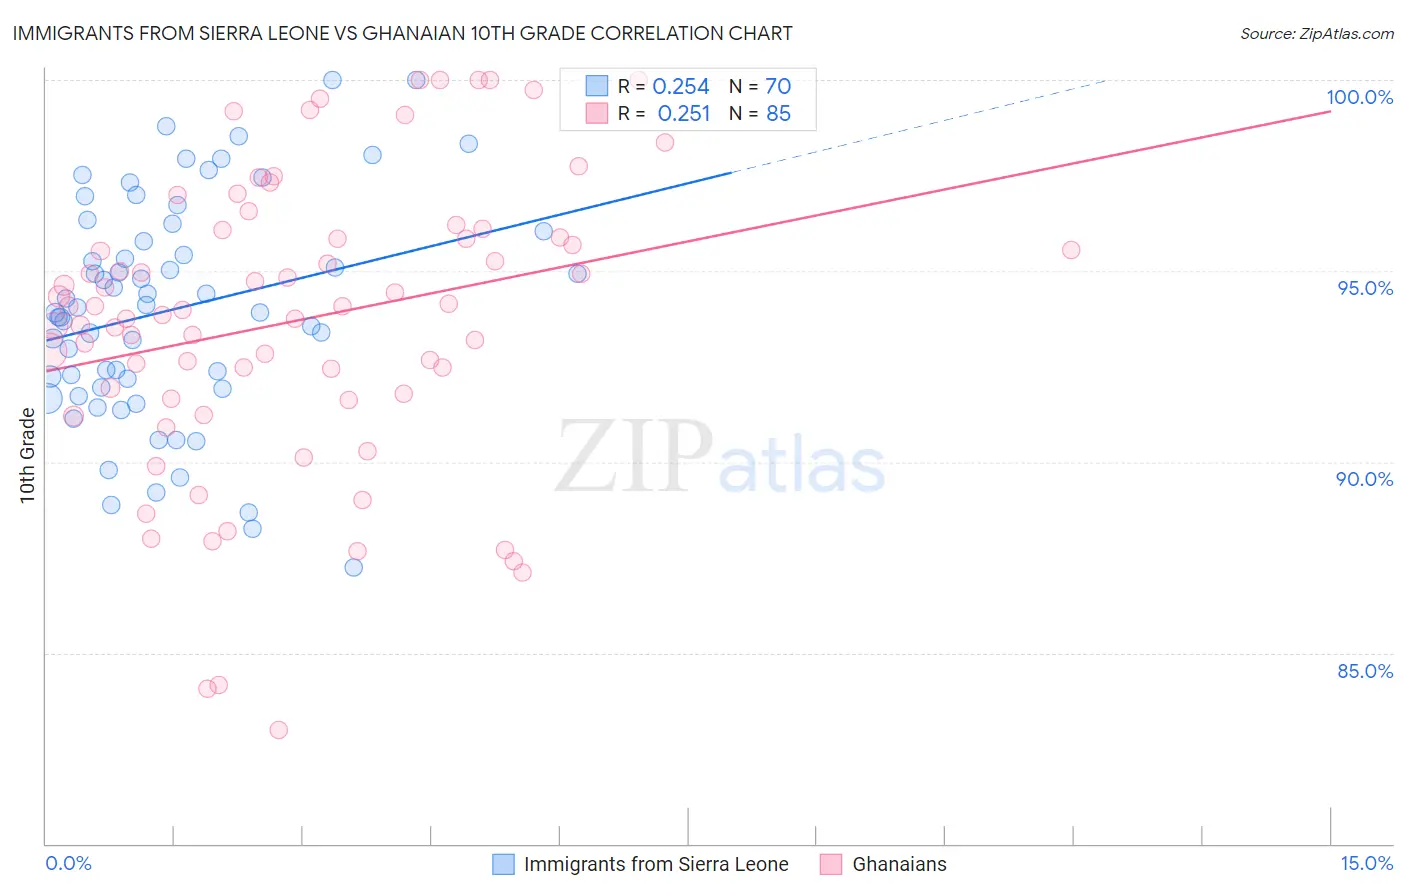
Immigrants from Sierra Leone vs Ghanaian 10th Grade Correlation Chart
The statistical analysis conducted on geographies consisting of 101,634,956 people shows a weak positive correlation between the proportion of Immigrants from Sierra Leone and percentage of population with at least 10th grade education in the United States with a correlation coefficient (R) of 0.254 and weighted average of 93.2%. Similarly, the statistical analysis conducted on geographies consisting of 190,714,671 people shows a weak positive correlation between the proportion of Ghanaians and percentage of population with at least 10th grade education in the United States with a correlation coefficient (R) of 0.251 and weighted average of 92.8%, a difference of 0.49%.
10th Grade Correlation Summary
| Measurement | Immigrants from Sierra Leone | Ghanaian |
| Minimum | 87.2% | 83.0% |
| Maximum | 100.0% | 100.0% |
| Range | 12.8% | 17.0% |
| Mean | 94.0% | 93.7% |
| Median | 94.0% | 94.1% |
| Interquartile 25% (IQ1) | 91.9% | 91.7% |
| Interquartile 75% (IQ3) | 96.1% | 96.0% |
| Interquartile Range (IQR) | 4.1% | 4.3% |
| Standard Deviation (Sample) | 2.9% | 3.8% |
| Standard Deviation (Population) | 2.9% | 3.8% |
Similar Demographics by 10th Grade
Demographics Similar to Immigrants from Sierra Leone by 10th Grade
In terms of 10th grade, the demographic groups most similar to Immigrants from Sierra Leone are Ethiopian (93.2%, a difference of 0.010%), Bolivian (93.2%, a difference of 0.030%), Immigrants from Southern Europe (93.2%, a difference of 0.040%), Tongan (93.3%, a difference of 0.050%), and Somali (93.2%, a difference of 0.050%).
| Demographics | Rating | Rank | 10th Grade |
| Immigrants | Eastern Africa | 14.7 /100 | #216 | Poor 93.4% |
| Portuguese | 12.1 /100 | #217 | Poor 93.3% |
| Immigrants | Liberia | 10.2 /100 | #218 | Poor 93.3% |
| Seminole | 10.2 /100 | #219 | Poor 93.3% |
| Tongans | 9.5 /100 | #220 | Tragic 93.3% |
| Immigrants | Southern Europe | 8.9 /100 | #221 | Tragic 93.2% |
| Ethiopians | 7.9 /100 | #222 | Tragic 93.2% |
| Immigrants | Sierra Leone | 7.6 /100 | #223 | Tragic 93.2% |
| Bolivians | 6.7 /100 | #224 | Tragic 93.2% |
| Somalis | 6.2 /100 | #225 | Tragic 93.2% |
| Koreans | 6.1 /100 | #226 | Tragic 93.2% |
| Blacks/African Americans | 6.0 /100 | #227 | Tragic 93.2% |
| Immigrants | China | 5.9 /100 | #228 | Tragic 93.2% |
| Immigrants | Ethiopia | 5.1 /100 | #229 | Tragic 93.1% |
| Immigrants | Africa | 5.0 /100 | #230 | Tragic 93.1% |
Demographics Similar to Ghanaians by 10th Grade
In terms of 10th grade, the demographic groups most similar to Ghanaians are South American (92.8%, a difference of 0.0%), Immigrants from Thailand (92.8%, a difference of 0.010%), Armenian (92.7%, a difference of 0.010%), Jamaican (92.8%, a difference of 0.060%), and Immigrants from Bolivia (92.7%, a difference of 0.060%).
| Demographics | Rating | Rank | 10th Grade |
| Immigrants | Middle Africa | 1.7 /100 | #246 | Tragic 92.9% |
| Immigrants | Afghanistan | 1.4 /100 | #247 | Tragic 92.8% |
| Colombians | 1.4 /100 | #248 | Tragic 92.8% |
| Immigrants | Senegal | 1.4 /100 | #249 | Tragic 92.8% |
| Jamaicans | 1.2 /100 | #250 | Tragic 92.8% |
| Immigrants | Thailand | 1.0 /100 | #251 | Tragic 92.8% |
| South Americans | 0.9 /100 | #252 | Tragic 92.8% |
| Ghanaians | 0.9 /100 | #253 | Tragic 92.8% |
| Armenians | 0.9 /100 | #254 | Tragic 92.7% |
| Immigrants | Bolivia | 0.7 /100 | #255 | Tragic 92.7% |
| Immigrants | Nigeria | 0.7 /100 | #256 | Tragic 92.7% |
| U.S. Virgin Islanders | 0.7 /100 | #257 | Tragic 92.7% |
| Immigrants | Costa Rica | 0.6 /100 | #258 | Tragic 92.7% |
| Immigrants | Jamaica | 0.5 /100 | #259 | Tragic 92.6% |
| Immigrants | Uzbekistan | 0.5 /100 | #260 | Tragic 92.6% |