Immigrants from Sierra Leone vs Salvadoran 10th Grade
COMPARE
Immigrants from Sierra Leone
Salvadoran
10th Grade
10th Grade Comparison
Immigrants from Sierra Leone
Salvadorans
93.2%
10TH GRADE
7.6/ 100
METRIC RATING
223rd/ 347
METRIC RANK
87.5%
10TH GRADE
0.0/ 100
METRIC RATING
341st/ 347
METRIC RANK
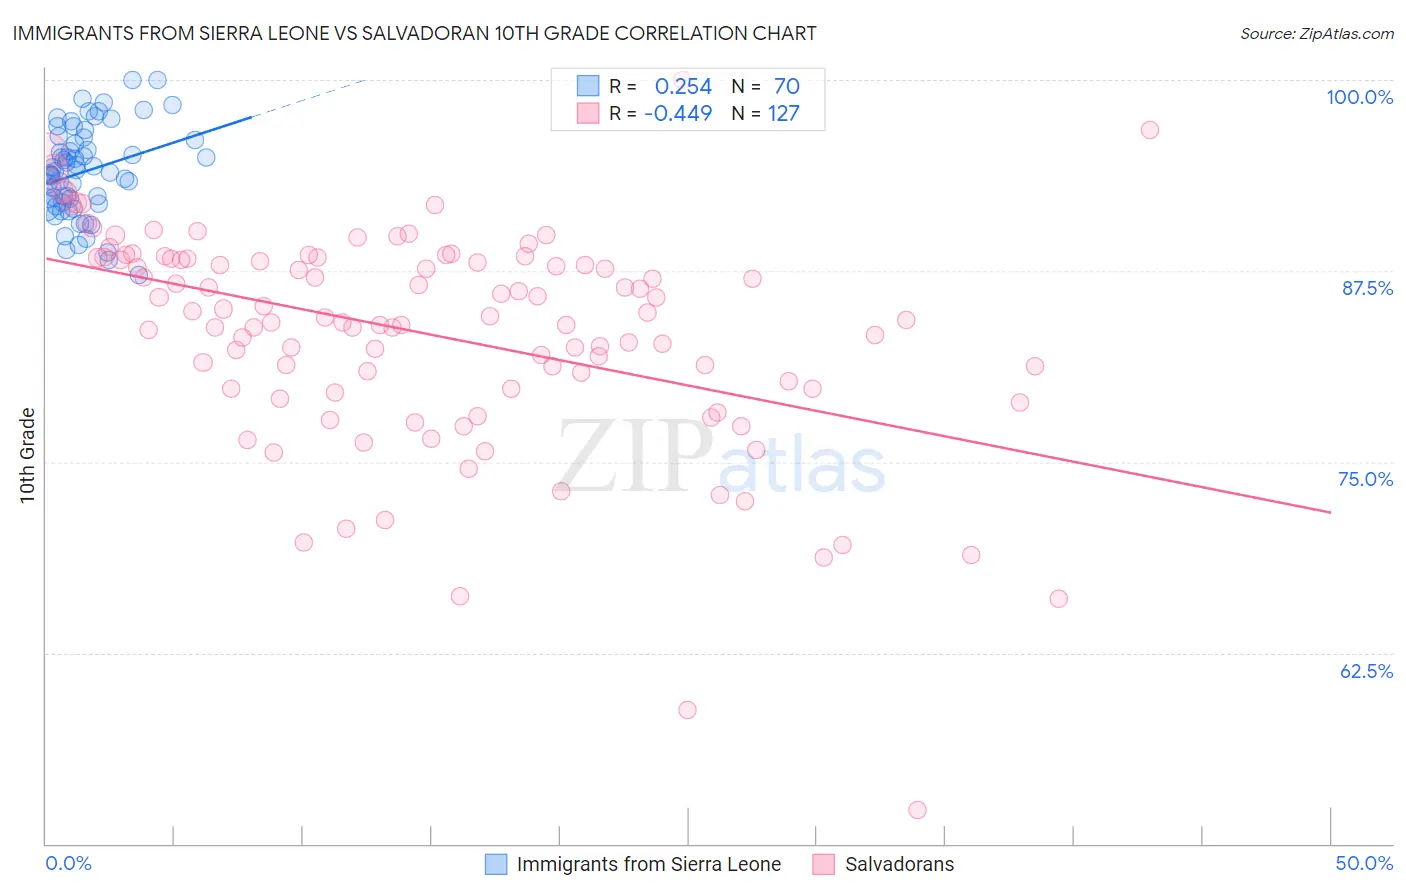
Immigrants from Sierra Leone vs Salvadoran 10th Grade Correlation Chart
The statistical analysis conducted on geographies consisting of 101,634,956 people shows a weak positive correlation between the proportion of Immigrants from Sierra Leone and percentage of population with at least 10th grade education in the United States with a correlation coefficient (R) of 0.254 and weighted average of 93.2%. Similarly, the statistical analysis conducted on geographies consisting of 399,034,410 people shows a moderate negative correlation between the proportion of Salvadorans and percentage of population with at least 10th grade education in the United States with a correlation coefficient (R) of -0.449 and weighted average of 87.5%, a difference of 6.5%.
10th Grade Correlation Summary
| Measurement | Immigrants from Sierra Leone | Salvadoran |
| Minimum | 87.2% | 52.2% |
| Maximum | 100.0% | 100.0% |
| Range | 12.8% | 47.8% |
| Mean | 94.0% | 83.4% |
| Median | 94.0% | 84.5% |
| Interquartile 25% (IQ1) | 91.9% | 79.8% |
| Interquartile 75% (IQ3) | 96.1% | 88.3% |
| Interquartile Range (IQR) | 4.1% | 8.5% |
| Standard Deviation (Sample) | 2.9% | 7.3% |
| Standard Deviation (Population) | 2.9% | 7.3% |
Similar Demographics by 10th Grade
Demographics Similar to Immigrants from Sierra Leone by 10th Grade
In terms of 10th grade, the demographic groups most similar to Immigrants from Sierra Leone are Ethiopian (93.2%, a difference of 0.010%), Bolivian (93.2%, a difference of 0.030%), Immigrants from Southern Europe (93.2%, a difference of 0.040%), Tongan (93.3%, a difference of 0.050%), and Somali (93.2%, a difference of 0.050%).
| Demographics | Rating | Rank | 10th Grade |
| Immigrants | Eastern Africa | 14.7 /100 | #216 | Poor 93.4% |
| Portuguese | 12.1 /100 | #217 | Poor 93.3% |
| Immigrants | Liberia | 10.2 /100 | #218 | Poor 93.3% |
| Seminole | 10.2 /100 | #219 | Poor 93.3% |
| Tongans | 9.5 /100 | #220 | Tragic 93.3% |
| Immigrants | Southern Europe | 8.9 /100 | #221 | Tragic 93.2% |
| Ethiopians | 7.9 /100 | #222 | Tragic 93.2% |
| Immigrants | Sierra Leone | 7.6 /100 | #223 | Tragic 93.2% |
| Bolivians | 6.7 /100 | #224 | Tragic 93.2% |
| Somalis | 6.2 /100 | #225 | Tragic 93.2% |
| Koreans | 6.1 /100 | #226 | Tragic 93.2% |
| Blacks/African Americans | 6.0 /100 | #227 | Tragic 93.2% |
| Immigrants | China | 5.9 /100 | #228 | Tragic 93.2% |
| Immigrants | Ethiopia | 5.1 /100 | #229 | Tragic 93.1% |
| Immigrants | Africa | 5.0 /100 | #230 | Tragic 93.1% |
Demographics Similar to Salvadorans by 10th Grade
In terms of 10th grade, the demographic groups most similar to Salvadorans are Immigrants from Guatemala (87.4%, a difference of 0.16%), Mexican (87.8%, a difference of 0.29%), Guatemalan (87.9%, a difference of 0.44%), Yakama (86.9%, a difference of 0.74%), and Immigrants from El Salvador (86.8%, a difference of 0.88%).
| Demographics | Rating | Rank | 10th Grade |
| Hondurans | 0.0 /100 | #333 | Tragic 89.0% |
| Hispanics or Latinos | 0.0 /100 | #334 | Tragic 88.9% |
| Immigrants | Dominican Republic | 0.0 /100 | #335 | Tragic 88.7% |
| Immigrants | Honduras | 0.0 /100 | #336 | Tragic 88.5% |
| Central Americans | 0.0 /100 | #337 | Tragic 88.4% |
| Immigrants | Latin America | 0.0 /100 | #338 | Tragic 88.3% |
| Guatemalans | 0.0 /100 | #339 | Tragic 87.9% |
| Mexicans | 0.0 /100 | #340 | Tragic 87.8% |
| Salvadorans | 0.0 /100 | #341 | Tragic 87.5% |
| Immigrants | Guatemala | 0.0 /100 | #342 | Tragic 87.4% |
| Yakama | 0.0 /100 | #343 | Tragic 86.9% |
| Immigrants | El Salvador | 0.0 /100 | #344 | Tragic 86.8% |
| Immigrants | Central America | 0.0 /100 | #345 | Tragic 86.6% |
| Spanish American Indians | 0.0 /100 | #346 | Tragic 86.2% |
| Immigrants | Mexico | 0.0 /100 | #347 | Tragic 86.2% |