Trinidadian and Tobagonian vs Ghanaian 10th Grade
COMPARE
Trinidadian and Tobagonian
Ghanaian
10th Grade
10th Grade Comparison
Trinidadians and Tobagonians
Ghanaians
92.4%
10TH GRADE
0.2/ 100
METRIC RATING
273rd/ 347
METRIC RANK
92.8%
10TH GRADE
0.9/ 100
METRIC RATING
253rd/ 347
METRIC RANK
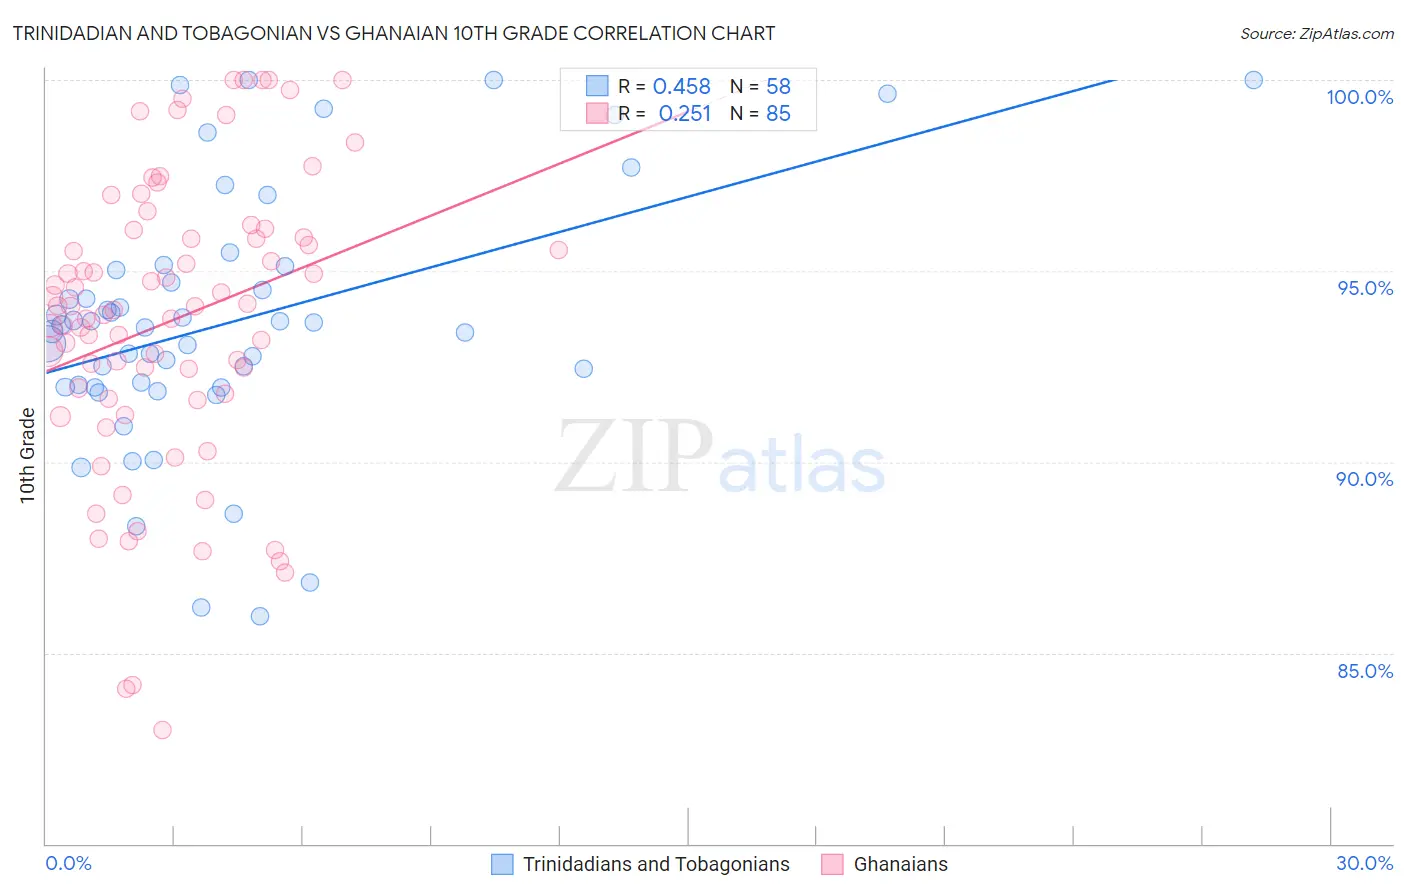
Trinidadian and Tobagonian vs Ghanaian 10th Grade Correlation Chart
The statistical analysis conducted on geographies consisting of 219,881,170 people shows a moderate positive correlation between the proportion of Trinidadians and Tobagonians and percentage of population with at least 10th grade education in the United States with a correlation coefficient (R) of 0.458 and weighted average of 92.4%. Similarly, the statistical analysis conducted on geographies consisting of 190,714,671 people shows a weak positive correlation between the proportion of Ghanaians and percentage of population with at least 10th grade education in the United States with a correlation coefficient (R) of 0.251 and weighted average of 92.8%, a difference of 0.33%.
10th Grade Correlation Summary
| Measurement | Trinidadian and Tobagonian | Ghanaian |
| Minimum | 86.0% | 83.0% |
| Maximum | 100.0% | 100.0% |
| Range | 14.0% | 17.0% |
| Mean | 93.7% | 93.7% |
| Median | 93.5% | 94.1% |
| Interquartile 25% (IQ1) | 92.0% | 91.7% |
| Interquartile 75% (IQ3) | 95.0% | 96.0% |
| Interquartile Range (IQR) | 3.1% | 4.3% |
| Standard Deviation (Sample) | 3.3% | 3.8% |
| Standard Deviation (Population) | 3.3% | 3.8% |
Demographics Similar to Trinidadians and Tobagonians and Ghanaians by 10th Grade
In terms of 10th grade, the demographic groups most similar to Trinidadians and Tobagonians are Immigrants from Western Africa (92.5%, a difference of 0.070%), Immigrants from Eritrea (92.5%, a difference of 0.080%), Immigrants from Colombia (92.5%, a difference of 0.090%), Immigrants from Uruguay (92.5%, a difference of 0.090%), and Taiwanese (92.5%, a difference of 0.11%). Similarly, the demographic groups most similar to Ghanaians are Armenian (92.7%, a difference of 0.010%), Immigrants from Bolivia (92.7%, a difference of 0.060%), Immigrants from Nigeria (92.7%, a difference of 0.070%), U.S. Virgin Islander (92.7%, a difference of 0.080%), and Immigrants from Costa Rica (92.7%, a difference of 0.090%).
| Demographics | Rating | Rank | 10th Grade |
| Ghanaians | 0.9 /100 | #253 | Tragic 92.8% |
| Armenians | 0.9 /100 | #254 | Tragic 92.7% |
| Immigrants | Bolivia | 0.7 /100 | #255 | Tragic 92.7% |
| Immigrants | Nigeria | 0.7 /100 | #256 | Tragic 92.7% |
| U.S. Virgin Islanders | 0.7 /100 | #257 | Tragic 92.7% |
| Immigrants | Costa Rica | 0.6 /100 | #258 | Tragic 92.7% |
| Immigrants | Jamaica | 0.5 /100 | #259 | Tragic 92.6% |
| Immigrants | Uzbekistan | 0.5 /100 | #260 | Tragic 92.6% |
| Paiute | 0.4 /100 | #261 | Tragic 92.6% |
| Immigrants | South America | 0.4 /100 | #262 | Tragic 92.6% |
| Apache | 0.4 /100 | #263 | Tragic 92.6% |
| Peruvians | 0.4 /100 | #264 | Tragic 92.6% |
| Dutch West Indians | 0.4 /100 | #265 | Tragic 92.6% |
| Immigrants | Philippines | 0.4 /100 | #266 | Tragic 92.6% |
| Taiwanese | 0.3 /100 | #267 | Tragic 92.5% |
| Immigrants | Ghana | 0.3 /100 | #268 | Tragic 92.5% |
| Immigrants | Colombia | 0.3 /100 | #269 | Tragic 92.5% |
| Immigrants | Uruguay | 0.3 /100 | #270 | Tragic 92.5% |
| Immigrants | Eritrea | 0.3 /100 | #271 | Tragic 92.5% |
| Immigrants | Western Africa | 0.3 /100 | #272 | Tragic 92.5% |
| Trinidadians and Tobagonians | 0.2 /100 | #273 | Tragic 92.4% |