Immigrants from Senegal vs Immigrants from Philippines 10th Grade
COMPARE
Immigrants from Senegal
Immigrants from Philippines
10th Grade
10th Grade Comparison
Immigrants from Senegal
Immigrants from Philippines
92.8%
10TH GRADE
1.4/ 100
METRIC RATING
249th/ 347
METRIC RANK
92.6%
10TH GRADE
0.4/ 100
METRIC RATING
266th/ 347
METRIC RANK
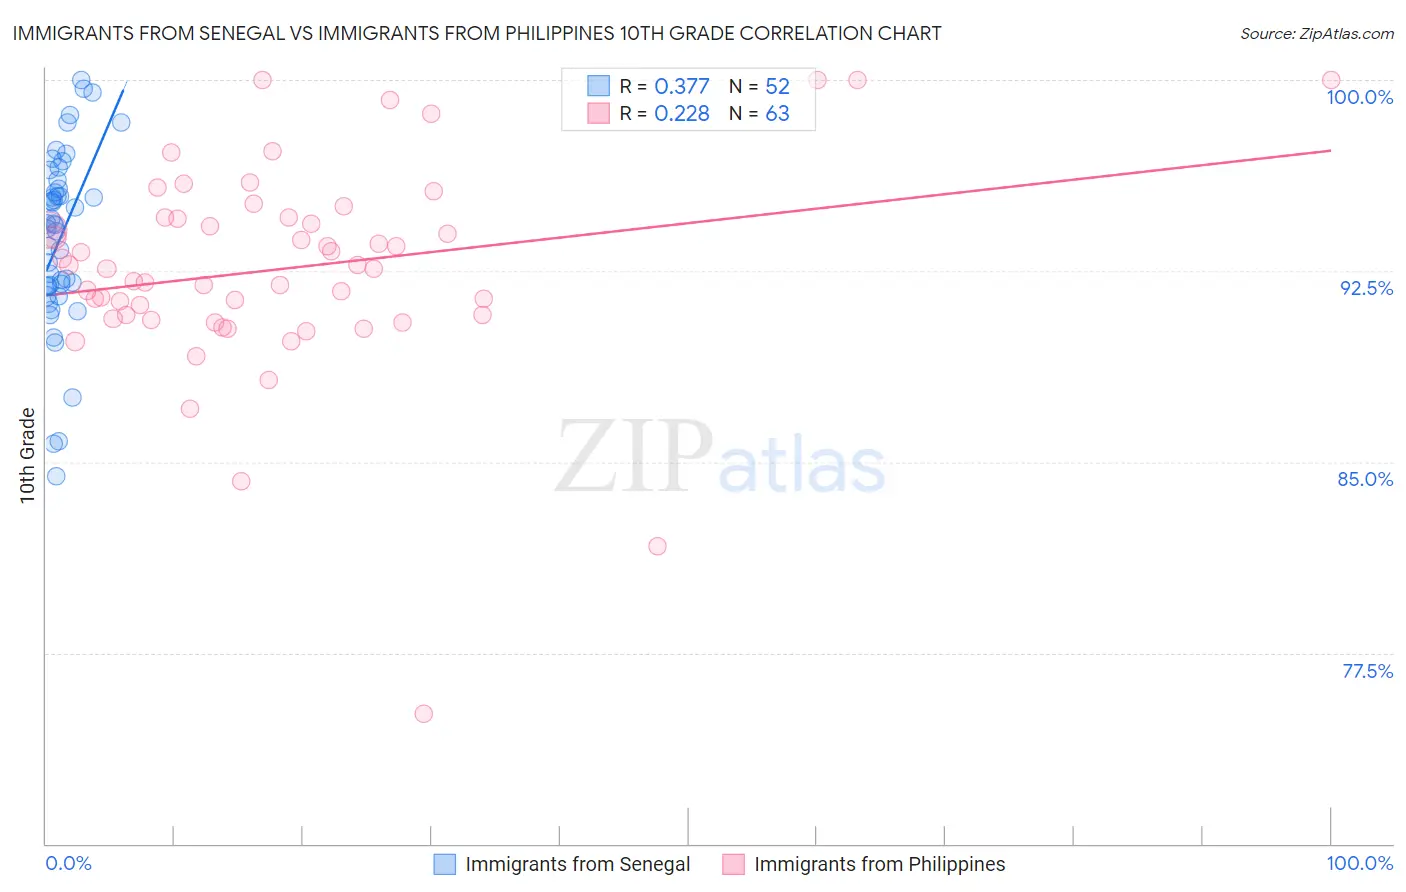
Immigrants from Senegal vs Immigrants from Philippines 10th Grade Correlation Chart
The statistical analysis conducted on geographies consisting of 90,130,297 people shows a mild positive correlation between the proportion of Immigrants from Senegal and percentage of population with at least 10th grade education in the United States with a correlation coefficient (R) of 0.377 and weighted average of 92.8%. Similarly, the statistical analysis conducted on geographies consisting of 471,300,535 people shows a weak positive correlation between the proportion of Immigrants from Philippines and percentage of population with at least 10th grade education in the United States with a correlation coefficient (R) of 0.228 and weighted average of 92.6%, a difference of 0.30%.
10th Grade Correlation Summary
| Measurement | Immigrants from Senegal | Immigrants from Philippines |
| Minimum | 84.4% | 75.1% |
| Maximum | 100.0% | 100.0% |
| Range | 15.6% | 24.9% |
| Mean | 93.8% | 92.6% |
| Median | 94.3% | 92.6% |
| Interquartile 25% (IQ1) | 91.9% | 90.6% |
| Interquartile 75% (IQ3) | 95.9% | 94.6% |
| Interquartile Range (IQR) | 4.0% | 4.0% |
| Standard Deviation (Sample) | 3.5% | 4.1% |
| Standard Deviation (Population) | 3.4% | 4.1% |
Demographics Similar to Immigrants from Senegal and Immigrants from Philippines by 10th Grade
In terms of 10th grade, the demographic groups most similar to Immigrants from Senegal are Immigrants from Afghanistan (92.8%, a difference of 0.010%), Colombian (92.8%, a difference of 0.010%), Jamaican (92.8%, a difference of 0.020%), Immigrants from Thailand (92.8%, a difference of 0.080%), and South American (92.8%, a difference of 0.080%). Similarly, the demographic groups most similar to Immigrants from Philippines are Dutch West Indian (92.6%, a difference of 0.0%), Taiwanese (92.5%, a difference of 0.010%), Immigrants from South America (92.6%, a difference of 0.030%), Apache (92.6%, a difference of 0.030%), and Peruvian (92.6%, a difference of 0.030%).
| Demographics | Rating | Rank | 10th Grade |
| Immigrants | Afghanistan | 1.4 /100 | #247 | Tragic 92.8% |
| Colombians | 1.4 /100 | #248 | Tragic 92.8% |
| Immigrants | Senegal | 1.4 /100 | #249 | Tragic 92.8% |
| Jamaicans | 1.2 /100 | #250 | Tragic 92.8% |
| Immigrants | Thailand | 1.0 /100 | #251 | Tragic 92.8% |
| South Americans | 0.9 /100 | #252 | Tragic 92.8% |
| Ghanaians | 0.9 /100 | #253 | Tragic 92.8% |
| Armenians | 0.9 /100 | #254 | Tragic 92.7% |
| Immigrants | Bolivia | 0.7 /100 | #255 | Tragic 92.7% |
| Immigrants | Nigeria | 0.7 /100 | #256 | Tragic 92.7% |
| U.S. Virgin Islanders | 0.7 /100 | #257 | Tragic 92.7% |
| Immigrants | Costa Rica | 0.6 /100 | #258 | Tragic 92.7% |
| Immigrants | Jamaica | 0.5 /100 | #259 | Tragic 92.6% |
| Immigrants | Uzbekistan | 0.5 /100 | #260 | Tragic 92.6% |
| Paiute | 0.4 /100 | #261 | Tragic 92.6% |
| Immigrants | South America | 0.4 /100 | #262 | Tragic 92.6% |
| Apache | 0.4 /100 | #263 | Tragic 92.6% |
| Peruvians | 0.4 /100 | #264 | Tragic 92.6% |
| Dutch West Indians | 0.4 /100 | #265 | Tragic 92.6% |
| Immigrants | Philippines | 0.4 /100 | #266 | Tragic 92.6% |
| Taiwanese | 0.3 /100 | #267 | Tragic 92.5% |