Immigrants from Philippines vs Immigrants from Kenya Kindergarten
COMPARE
Immigrants from Philippines
Immigrants from Kenya
Kindergarten
Kindergarten Comparison
Immigrants from Philippines
Immigrants from Kenya
97.4%
KINDERGARTEN
0.1/ 100
METRIC RATING
276th/ 347
METRIC RANK
97.9%
KINDERGARTEN
25.5/ 100
METRIC RATING
197th/ 347
METRIC RANK
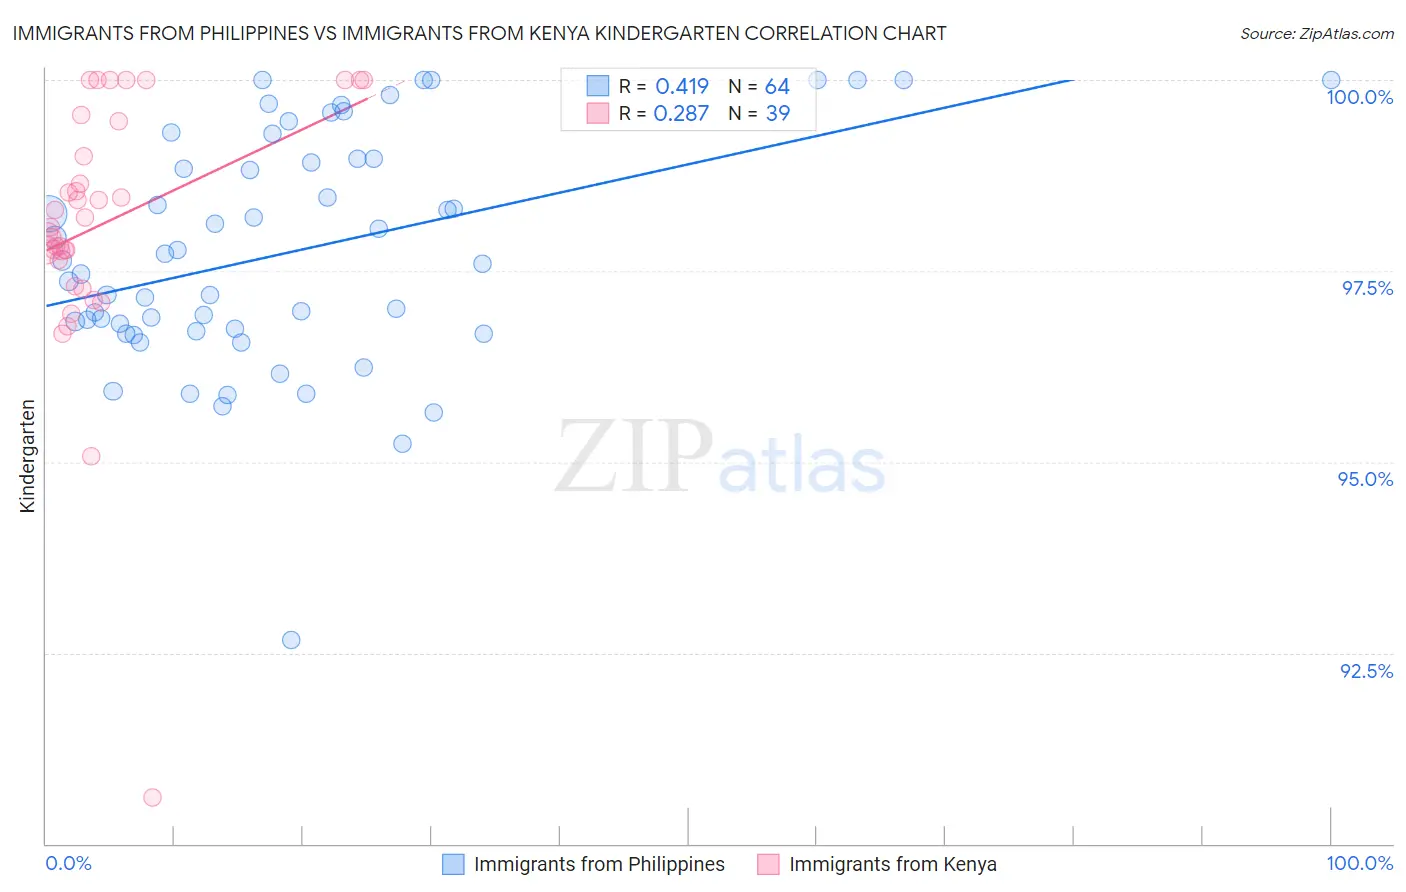
Immigrants from Philippines vs Immigrants from Kenya Kindergarten Correlation Chart
The statistical analysis conducted on geographies consisting of 471,303,140 people shows a moderate positive correlation between the proportion of Immigrants from Philippines and percentage of population with at least kindergarten education in the United States with a correlation coefficient (R) of 0.419 and weighted average of 97.4%. Similarly, the statistical analysis conducted on geographies consisting of 218,076,690 people shows a weak positive correlation between the proportion of Immigrants from Kenya and percentage of population with at least kindergarten education in the United States with a correlation coefficient (R) of 0.287 and weighted average of 97.9%, a difference of 0.46%.
Kindergarten Correlation Summary
| Measurement | Immigrants from Philippines | Immigrants from Kenya |
| Minimum | 92.7% | 90.6% |
| Maximum | 100.0% | 100.0% |
| Range | 7.3% | 9.4% |
| Mean | 97.8% | 98.1% |
| Median | 97.6% | 98.1% |
| Interquartile 25% (IQ1) | 96.7% | 97.6% |
| Interquartile 75% (IQ3) | 99.0% | 99.5% |
| Interquartile Range (IQR) | 2.2% | 1.8% |
| Standard Deviation (Sample) | 1.5% | 1.7% |
| Standard Deviation (Population) | 1.5% | 1.7% |
Similar Demographics by Kindergarten
Demographics Similar to Immigrants from Philippines by Kindergarten
In terms of kindergarten, the demographic groups most similar to Immigrants from Philippines are Immigrants from Western Africa (97.4%, a difference of 0.010%), Immigrants from China (97.4%, a difference of 0.020%), Immigrants from Cameroon (97.4%, a difference of 0.020%), Ghanaian (97.4%, a difference of 0.020%), and Immigrants from Uzbekistan (97.4%, a difference of 0.030%).
| Demographics | Rating | Rank | Kindergarten |
| West Indians | 0.3 /100 | #269 | Tragic 97.5% |
| Immigrants | Jamaica | 0.2 /100 | #270 | Tragic 97.5% |
| Immigrants | Peru | 0.2 /100 | #271 | Tragic 97.5% |
| Immigrants | Bolivia | 0.2 /100 | #272 | Tragic 97.5% |
| Immigrants | China | 0.1 /100 | #273 | Tragic 97.4% |
| Immigrants | Cameroon | 0.1 /100 | #274 | Tragic 97.4% |
| Ghanaians | 0.1 /100 | #275 | Tragic 97.4% |
| Immigrants | Philippines | 0.1 /100 | #276 | Tragic 97.4% |
| Immigrants | Western Africa | 0.1 /100 | #277 | Tragic 97.4% |
| Immigrants | Uzbekistan | 0.1 /100 | #278 | Tragic 97.4% |
| Immigrants | Ghana | 0.1 /100 | #279 | Tragic 97.4% |
| Barbadians | 0.1 /100 | #280 | Tragic 97.4% |
| Trinidadians and Tobagonians | 0.1 /100 | #281 | Tragic 97.4% |
| Afghans | 0.0 /100 | #282 | Tragic 97.4% |
| Immigrants | West Indies | 0.0 /100 | #283 | Tragic 97.3% |
Demographics Similar to Immigrants from Kenya by Kindergarten
In terms of kindergarten, the demographic groups most similar to Immigrants from Kenya are Guamanian/Chamorro (97.9%, a difference of 0.0%), Tohono O'odham (97.9%, a difference of 0.0%), Hawaiian (97.9%, a difference of 0.010%), Mongolian (97.9%, a difference of 0.010%), and Immigrants from Egypt (97.9%, a difference of 0.010%).
| Demographics | Rating | Rank | Kindergarten |
| Panamanians | 33.3 /100 | #190 | Fair 97.9% |
| Immigrants | Taiwan | 30.7 /100 | #191 | Fair 97.9% |
| Blacks/African Americans | 29.9 /100 | #192 | Fair 97.9% |
| Paraguayans | 29.6 /100 | #193 | Fair 97.9% |
| Hawaiians | 29.3 /100 | #194 | Fair 97.9% |
| Mongolians | 28.9 /100 | #195 | Fair 97.9% |
| Guamanians/Chamorros | 26.2 /100 | #196 | Fair 97.9% |
| Immigrants | Kenya | 25.5 /100 | #197 | Fair 97.9% |
| Tohono O'odham | 24.6 /100 | #198 | Fair 97.9% |
| Immigrants | Egypt | 22.3 /100 | #199 | Fair 97.9% |
| Yuman | 21.6 /100 | #200 | Fair 97.9% |
| Immigrants | Lebanon | 20.9 /100 | #201 | Fair 97.9% |
| Immigrants | Ukraine | 19.1 /100 | #202 | Poor 97.8% |
| Immigrants | Uganda | 18.8 /100 | #203 | Poor 97.8% |
| Immigrants | Chile | 18.1 /100 | #204 | Poor 97.8% |