Immigrants from Morocco vs Immigrants from Kenya Kindergarten
COMPARE
Immigrants from Morocco
Immigrants from Kenya
Kindergarten
Kindergarten Comparison
Immigrants from Morocco
Immigrants from Kenya
97.7%
KINDERGARTEN
5.4/ 100
METRIC RATING
218th/ 347
METRIC RANK
97.9%
KINDERGARTEN
25.5/ 100
METRIC RATING
197th/ 347
METRIC RANK
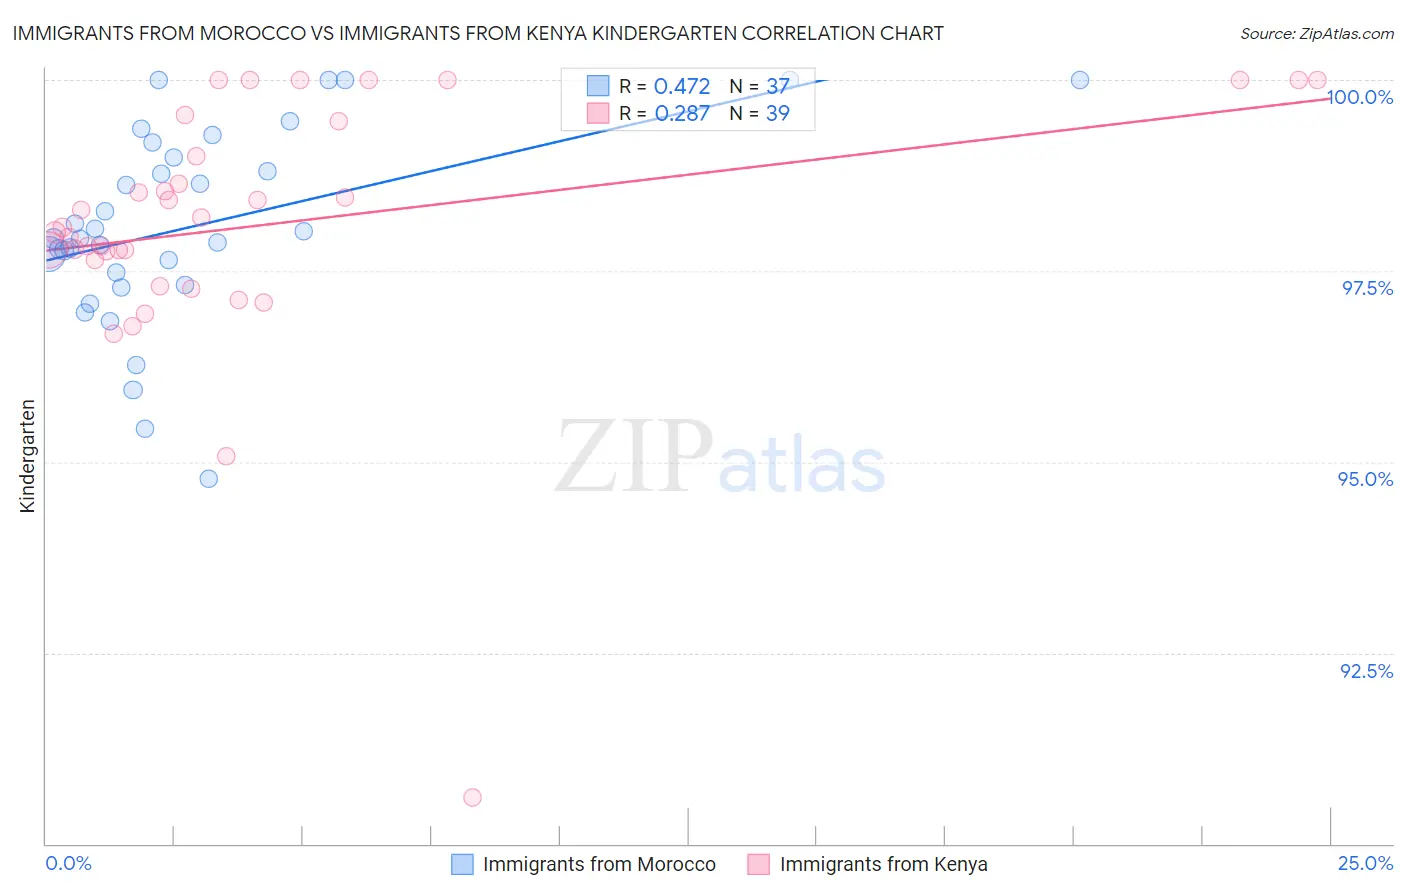
Immigrants from Morocco vs Immigrants from Kenya Kindergarten Correlation Chart
The statistical analysis conducted on geographies consisting of 178,912,438 people shows a moderate positive correlation between the proportion of Immigrants from Morocco and percentage of population with at least kindergarten education in the United States with a correlation coefficient (R) of 0.472 and weighted average of 97.7%. Similarly, the statistical analysis conducted on geographies consisting of 218,076,690 people shows a weak positive correlation between the proportion of Immigrants from Kenya and percentage of population with at least kindergarten education in the United States with a correlation coefficient (R) of 0.287 and weighted average of 97.9%, a difference of 0.14%.
Kindergarten Correlation Summary
| Measurement | Immigrants from Morocco | Immigrants from Kenya |
| Minimum | 94.8% | 90.6% |
| Maximum | 100.0% | 100.0% |
| Range | 5.2% | 9.4% |
| Mean | 98.1% | 98.1% |
| Median | 97.9% | 98.1% |
| Interquartile 25% (IQ1) | 97.4% | 97.6% |
| Interquartile 75% (IQ3) | 99.1% | 99.5% |
| Interquartile Range (IQR) | 1.7% | 1.8% |
| Standard Deviation (Sample) | 1.3% | 1.7% |
| Standard Deviation (Population) | 1.3% | 1.7% |
Similar Demographics by Kindergarten
Demographics Similar to Immigrants from Morocco by Kindergarten
In terms of kindergarten, the demographic groups most similar to Immigrants from Morocco are Immigrants from Panama (97.7%, a difference of 0.010%), Tongan (97.7%, a difference of 0.010%), Immigrants from Bahamas (97.8%, a difference of 0.020%), Samoan (97.8%, a difference of 0.020%), and Bahamian (97.8%, a difference of 0.020%).
| Demographics | Rating | Rank | Kindergarten |
| Laotians | 10.5 /100 | #211 | Poor 97.8% |
| Moroccans | 8.9 /100 | #212 | Tragic 97.8% |
| South American Indians | 7.7 /100 | #213 | Tragic 97.8% |
| Uruguayans | 7.5 /100 | #214 | Tragic 97.8% |
| Immigrants | Bahamas | 7.4 /100 | #215 | Tragic 97.8% |
| Samoans | 6.9 /100 | #216 | Tragic 97.8% |
| Bahamians | 6.6 /100 | #217 | Tragic 97.8% |
| Immigrants | Morocco | 5.4 /100 | #218 | Tragic 97.7% |
| Immigrants | Panama | 5.0 /100 | #219 | Tragic 97.7% |
| Tongans | 4.8 /100 | #220 | Tragic 97.7% |
| Immigrants | Zaire | 4.5 /100 | #221 | Tragic 97.7% |
| Immigrants | Sudan | 4.5 /100 | #222 | Tragic 97.7% |
| Immigrants | Syria | 4.3 /100 | #223 | Tragic 97.7% |
| Iraqis | 3.9 /100 | #224 | Tragic 97.7% |
| Immigrants | Nepal | 3.8 /100 | #225 | Tragic 97.7% |
Demographics Similar to Immigrants from Kenya by Kindergarten
In terms of kindergarten, the demographic groups most similar to Immigrants from Kenya are Guamanian/Chamorro (97.9%, a difference of 0.0%), Tohono O'odham (97.9%, a difference of 0.0%), Hawaiian (97.9%, a difference of 0.010%), Mongolian (97.9%, a difference of 0.010%), and Immigrants from Egypt (97.9%, a difference of 0.010%).
| Demographics | Rating | Rank | Kindergarten |
| Panamanians | 33.3 /100 | #190 | Fair 97.9% |
| Immigrants | Taiwan | 30.7 /100 | #191 | Fair 97.9% |
| Blacks/African Americans | 29.9 /100 | #192 | Fair 97.9% |
| Paraguayans | 29.6 /100 | #193 | Fair 97.9% |
| Hawaiians | 29.3 /100 | #194 | Fair 97.9% |
| Mongolians | 28.9 /100 | #195 | Fair 97.9% |
| Guamanians/Chamorros | 26.2 /100 | #196 | Fair 97.9% |
| Immigrants | Kenya | 25.5 /100 | #197 | Fair 97.9% |
| Tohono O'odham | 24.6 /100 | #198 | Fair 97.9% |
| Immigrants | Egypt | 22.3 /100 | #199 | Fair 97.9% |
| Yuman | 21.6 /100 | #200 | Fair 97.9% |
| Immigrants | Lebanon | 20.9 /100 | #201 | Fair 97.9% |
| Immigrants | Ukraine | 19.1 /100 | #202 | Poor 97.8% |
| Immigrants | Uganda | 18.8 /100 | #203 | Poor 97.8% |
| Immigrants | Chile | 18.1 /100 | #204 | Poor 97.8% |