Immigrants from Philippines vs Immigrants from Kenya Unemployment Among Seniors over 75 years
COMPARE
Immigrants from Philippines
Immigrants from Kenya
Unemployment Among Seniors over 75 years
Unemployment Among Seniors over 75 years Comparison
Immigrants from Philippines
Immigrants from Kenya
8.9%
UNEMPLOYMENT AMONG SENIORS OVER 75 YEARS
15.8/ 100
METRIC RATING
208th/ 347
METRIC RANK
8.8%
UNEMPLOYMENT AMONG SENIORS OVER 75 YEARS
31.8/ 100
METRIC RATING
192nd/ 347
METRIC RANK
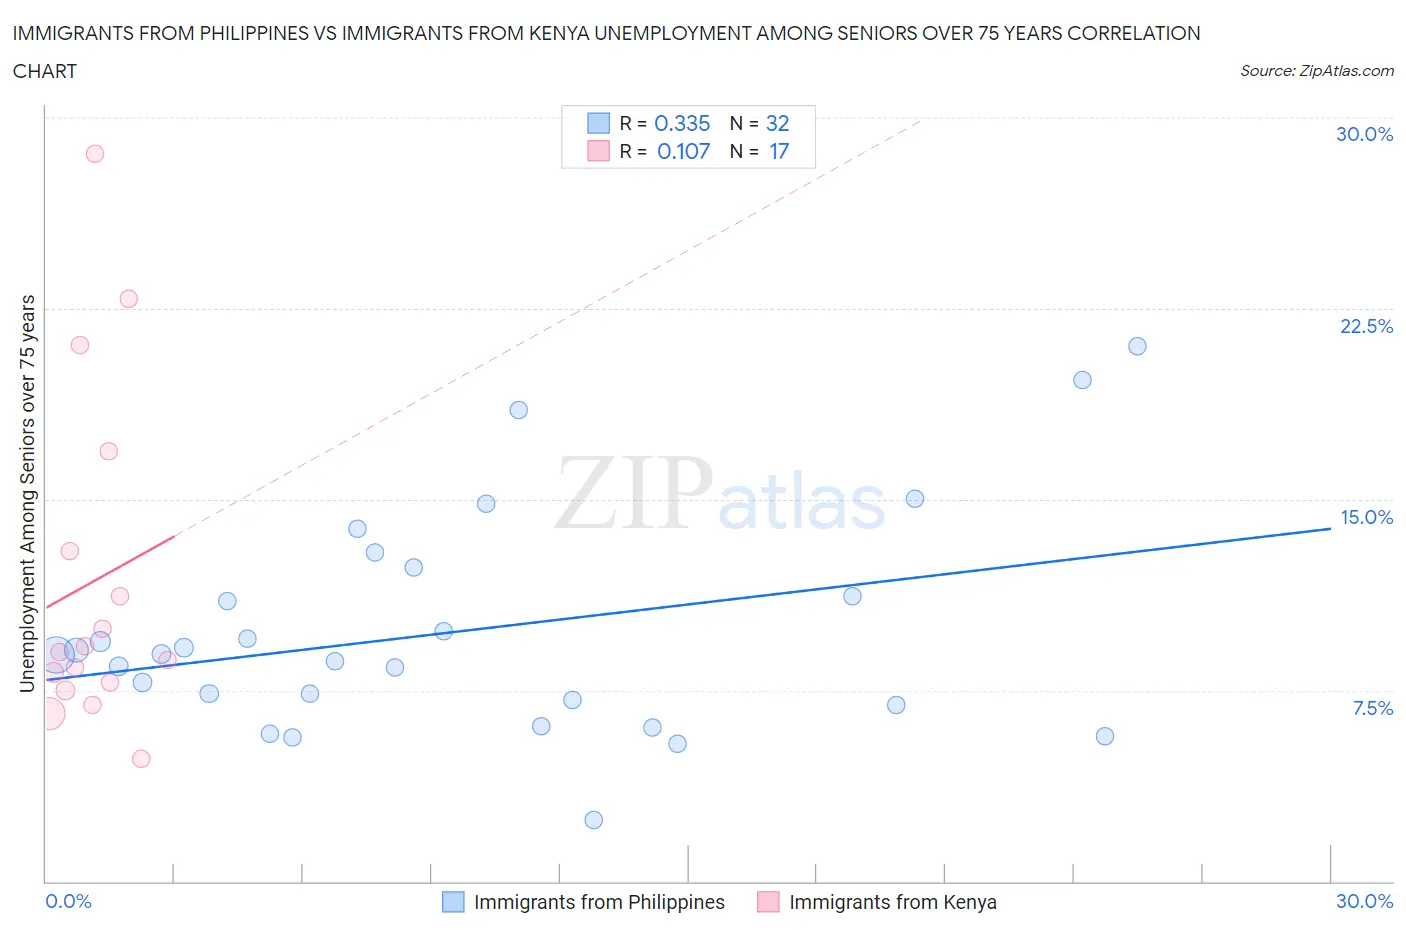
Immigrants from Philippines vs Immigrants from Kenya Unemployment Among Seniors over 75 years Correlation Chart
The statistical analysis conducted on geographies consisting of 220,800,454 people shows a mild positive correlation between the proportion of Immigrants from Philippines and unemployment rate among seniors over the age of 75 in the United States with a correlation coefficient (R) of 0.335 and weighted average of 8.9%. Similarly, the statistical analysis conducted on geographies consisting of 135,447,825 people shows a poor positive correlation between the proportion of Immigrants from Kenya and unemployment rate among seniors over the age of 75 in the United States with a correlation coefficient (R) of 0.107 and weighted average of 8.8%, a difference of 1.2%.
Unemployment Among Seniors over 75 years Correlation Summary
| Measurement | Immigrants from Philippines | Immigrants from Kenya |
| Minimum | 2.4% | 4.8% |
| Maximum | 21.0% | 28.6% |
| Range | 18.6% | 23.8% |
| Mean | 9.8% | 11.8% |
| Median | 8.9% | 9.0% |
| Interquartile 25% (IQ1) | 7.0% | 7.6% |
| Interquartile 75% (IQ3) | 11.8% | 14.9% |
| Interquartile Range (IQR) | 4.8% | 7.3% |
| Standard Deviation (Sample) | 4.3% | 6.6% |
| Standard Deviation (Population) | 4.3% | 6.4% |
Demographics Similar to Immigrants from Philippines and Immigrants from Kenya by Unemployment Among Seniors over 75 years
In terms of unemployment among seniors over 75 years, the demographic groups most similar to Immigrants from Philippines are Malaysian (8.9%, a difference of 0.040%), Salvadoran (8.9%, a difference of 0.050%), Bermudan (8.9%, a difference of 0.080%), Immigrants from Western Europe (8.9%, a difference of 0.22%), and Korean (8.9%, a difference of 0.52%). Similarly, the demographic groups most similar to Immigrants from Kenya are Estonian (8.8%, a difference of 0.090%), Immigrants from Guyana (8.8%, a difference of 0.12%), Mexican American Indian (8.8%, a difference of 0.17%), Maltese (8.8%, a difference of 0.17%), and Okinawan (8.8%, a difference of 0.18%).
| Demographics | Rating | Rank | Unemployment Among Seniors over 75 years |
| Mexican American Indians | 34.7 /100 | #190 | Fair 8.8% |
| Estonians | 33.3 /100 | #191 | Fair 8.8% |
| Immigrants | Kenya | 31.8 /100 | #192 | Fair 8.8% |
| Immigrants | Guyana | 29.9 /100 | #193 | Fair 8.8% |
| Maltese | 29.2 /100 | #194 | Fair 8.8% |
| Okinawans | 28.9 /100 | #195 | Fair 8.8% |
| Immigrants | Jamaica | 27.7 /100 | #196 | Fair 8.9% |
| Immigrants | Laos | 26.3 /100 | #197 | Fair 8.9% |
| Eastern Europeans | 25.9 /100 | #198 | Fair 8.9% |
| Pakistanis | 25.4 /100 | #199 | Fair 8.9% |
| Osage | 25.4 /100 | #200 | Fair 8.9% |
| Immigrants | Peru | 24.3 /100 | #201 | Fair 8.9% |
| Russians | 24.1 /100 | #202 | Fair 8.9% |
| Immigrants | Northern Europe | 23.9 /100 | #203 | Fair 8.9% |
| Spaniards | 22.0 /100 | #204 | Fair 8.9% |
| Koreans | 21.9 /100 | #205 | Fair 8.9% |
| Immigrants | Western Europe | 18.2 /100 | #206 | Poor 8.9% |
| Malaysians | 16.3 /100 | #207 | Poor 8.9% |
| Immigrants | Philippines | 15.8 /100 | #208 | Poor 8.9% |
| Salvadorans | 15.4 /100 | #209 | Poor 8.9% |
| Bermudans | 15.0 /100 | #210 | Poor 8.9% |