Immigrants from Micronesia vs Immigrants from Bosnia and Herzegovina 5th Grade
COMPARE
Immigrants from Micronesia
Immigrants from Bosnia and Herzegovina
5th Grade
5th Grade Comparison
Immigrants from Micronesia
Immigrants from Bosnia and Herzegovina
97.3%
5TH GRADE
48.8/ 100
METRIC RATING
175th/ 347
METRIC RANK
97.4%
5TH GRADE
71.0/ 100
METRIC RATING
155th/ 347
METRIC RANK
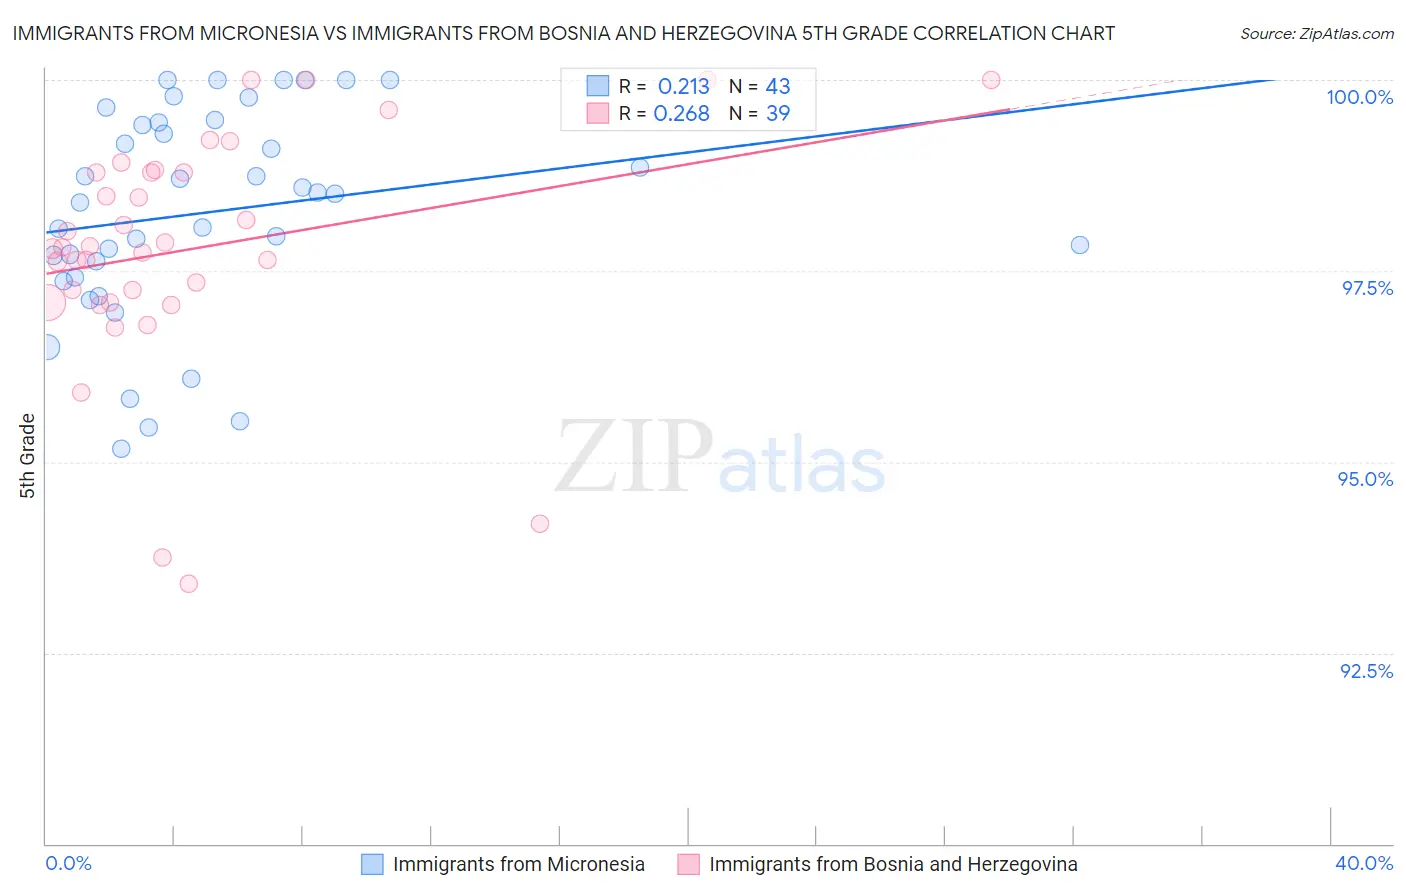
Immigrants from Micronesia vs Immigrants from Bosnia and Herzegovina 5th Grade Correlation Chart
The statistical analysis conducted on geographies consisting of 61,604,657 people shows a weak positive correlation between the proportion of Immigrants from Micronesia and percentage of population with at least 5th grade education in the United States with a correlation coefficient (R) of 0.213 and weighted average of 97.3%. Similarly, the statistical analysis conducted on geographies consisting of 156,779,463 people shows a weak positive correlation between the proportion of Immigrants from Bosnia and Herzegovina and percentage of population with at least 5th grade education in the United States with a correlation coefficient (R) of 0.268 and weighted average of 97.4%, a difference of 0.10%.
5th Grade Correlation Summary
| Measurement | Immigrants from Micronesia | Immigrants from Bosnia and Herzegovina |
| Minimum | 95.2% | 93.4% |
| Maximum | 100.0% | 100.0% |
| Range | 4.8% | 6.6% |
| Mean | 98.3% | 97.8% |
| Median | 98.5% | 97.8% |
| Interquartile 25% (IQ1) | 97.4% | 97.1% |
| Interquartile 75% (IQ3) | 99.4% | 98.8% |
| Interquartile Range (IQR) | 2.0% | 1.7% |
| Standard Deviation (Sample) | 1.4% | 1.5% |
| Standard Deviation (Population) | 1.4% | 1.5% |
Demographics Similar to Immigrants from Micronesia and Immigrants from Bosnia and Herzegovina by 5th Grade
In terms of 5th grade, the demographic groups most similar to Immigrants from Micronesia are Egyptian (97.3%, a difference of 0.010%), Immigrants from Kazakhstan (97.3%, a difference of 0.010%), Immigrants from Belarus (97.3%, a difference of 0.020%), Chilean (97.3%, a difference of 0.020%), and Immigrants from Korea (97.3%, a difference of 0.020%). Similarly, the demographic groups most similar to Immigrants from Bosnia and Herzegovina are French American Indian (97.4%, a difference of 0.0%), Immigrants from Jordan (97.4%, a difference of 0.0%), Albanian (97.4%, a difference of 0.010%), Immigrants from Italy (97.4%, a difference of 0.030%), and Marshallese (97.4%, a difference of 0.050%).
| Demographics | Rating | Rank | 5th Grade |
| Immigrants | Bosnia and Herzegovina | 71.0 /100 | #155 | Good 97.4% |
| French American Indians | 70.5 /100 | #156 | Good 97.4% |
| Immigrants | Jordan | 70.4 /100 | #157 | Good 97.4% |
| Albanians | 68.3 /100 | #158 | Good 97.4% |
| Immigrants | Italy | 65.2 /100 | #159 | Good 97.4% |
| Marshallese | 61.2 /100 | #160 | Good 97.4% |
| Kenyans | 59.7 /100 | #161 | Average 97.4% |
| Immigrants | Iran | 59.5 /100 | #162 | Average 97.4% |
| Ugandans | 58.9 /100 | #163 | Average 97.4% |
| Bermudans | 58.8 /100 | #164 | Average 97.4% |
| Immigrants | Poland | 57.9 /100 | #165 | Average 97.4% |
| Apache | 57.2 /100 | #166 | Average 97.4% |
| Immigrants | Belarus | 54.6 /100 | #167 | Average 97.3% |
| Chileans | 54.5 /100 | #168 | Average 97.3% |
| Immigrants | Korea | 54.1 /100 | #169 | Average 97.3% |
| Venezuelans | 54.0 /100 | #170 | Average 97.3% |
| Immigrants | Sri Lanka | 53.8 /100 | #171 | Average 97.3% |
| Arabs | 53.4 /100 | #172 | Average 97.3% |
| Egyptians | 52.4 /100 | #173 | Average 97.3% |
| Immigrants | Kazakhstan | 50.0 /100 | #174 | Average 97.3% |
| Immigrants | Micronesia | 48.8 /100 | #175 | Average 97.3% |