Immigrants from Micronesia vs Burmese 5th Grade
COMPARE
Immigrants from Micronesia
Burmese
5th Grade
5th Grade Comparison
Immigrants from Micronesia
Burmese
97.3%
5TH GRADE
48.8/ 100
METRIC RATING
175th/ 347
METRIC RANK
97.5%
5TH GRADE
86.1/ 100
METRIC RATING
140th/ 347
METRIC RANK
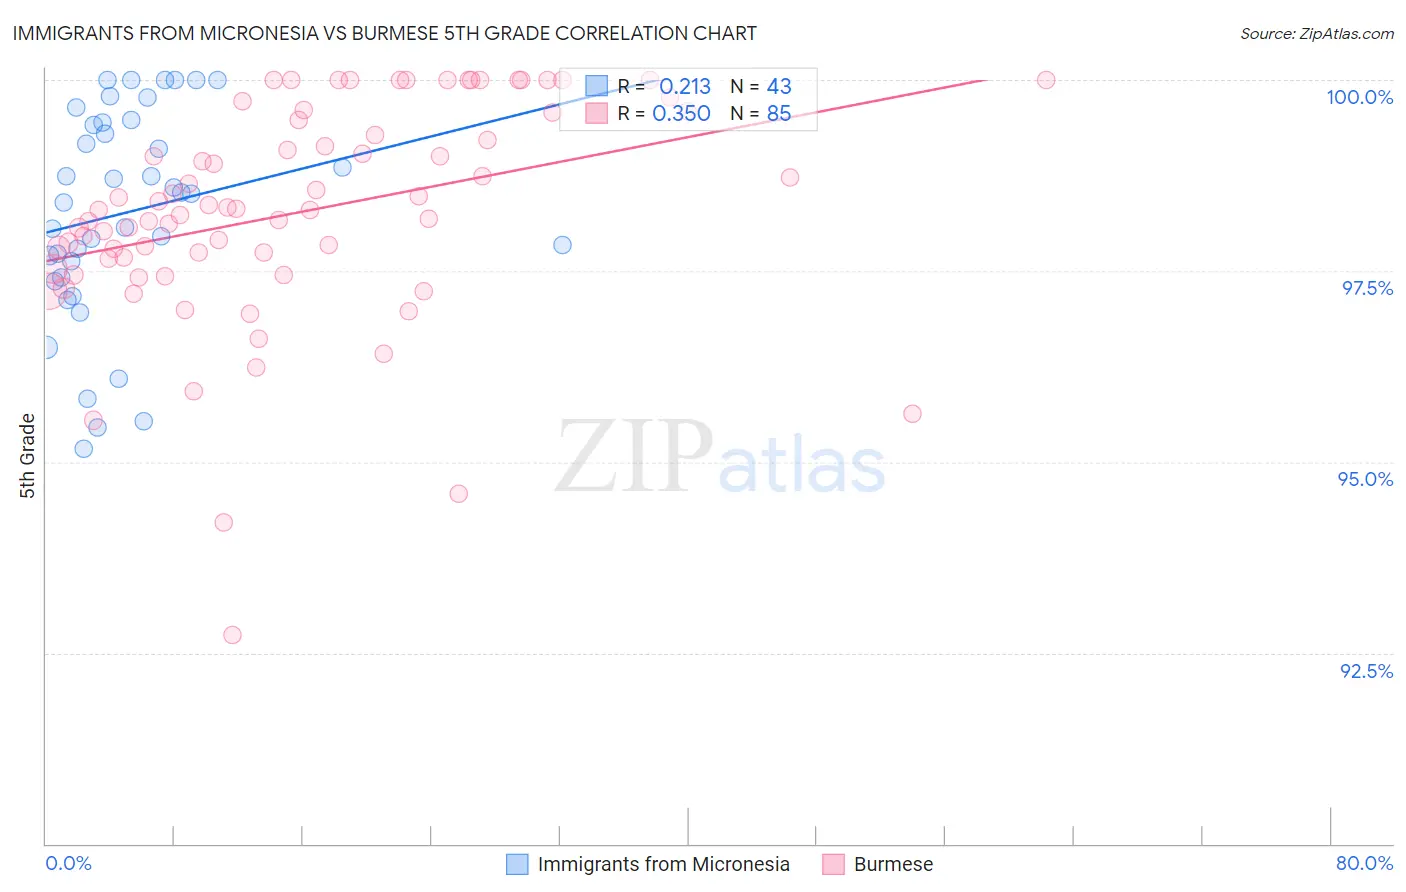
Immigrants from Micronesia vs Burmese 5th Grade Correlation Chart
The statistical analysis conducted on geographies consisting of 61,604,657 people shows a weak positive correlation between the proportion of Immigrants from Micronesia and percentage of population with at least 5th grade education in the United States with a correlation coefficient (R) of 0.213 and weighted average of 97.3%. Similarly, the statistical analysis conducted on geographies consisting of 465,275,994 people shows a mild positive correlation between the proportion of Burmese and percentage of population with at least 5th grade education in the United States with a correlation coefficient (R) of 0.350 and weighted average of 97.5%, a difference of 0.19%.
5th Grade Correlation Summary
| Measurement | Immigrants from Micronesia | Burmese |
| Minimum | 95.2% | 92.7% |
| Maximum | 100.0% | 100.0% |
| Range | 4.8% | 7.3% |
| Mean | 98.3% | 98.3% |
| Median | 98.5% | 98.3% |
| Interquartile 25% (IQ1) | 97.4% | 97.6% |
| Interquartile 75% (IQ3) | 99.4% | 99.5% |
| Interquartile Range (IQR) | 2.0% | 1.9% |
| Standard Deviation (Sample) | 1.4% | 1.4% |
| Standard Deviation (Population) | 1.4% | 1.4% |
Similar Demographics by 5th Grade
Demographics Similar to Immigrants from Micronesia by 5th Grade
In terms of 5th grade, the demographic groups most similar to Immigrants from Micronesia are Immigrants from Taiwan (97.3%, a difference of 0.0%), Egyptian (97.3%, a difference of 0.010%), Immigrants from Kazakhstan (97.3%, a difference of 0.010%), Immigrants from Spain (97.3%, a difference of 0.010%), and Chilean (97.3%, a difference of 0.020%).
| Demographics | Rating | Rank | 5th Grade |
| Chileans | 54.5 /100 | #168 | Average 97.3% |
| Immigrants | Korea | 54.1 /100 | #169 | Average 97.3% |
| Venezuelans | 54.0 /100 | #170 | Average 97.3% |
| Immigrants | Sri Lanka | 53.8 /100 | #171 | Average 97.3% |
| Arabs | 53.4 /100 | #172 | Average 97.3% |
| Egyptians | 52.4 /100 | #173 | Average 97.3% |
| Immigrants | Kazakhstan | 50.0 /100 | #174 | Average 97.3% |
| Immigrants | Micronesia | 48.8 /100 | #175 | Average 97.3% |
| Immigrants | Taiwan | 48.4 /100 | #176 | Average 97.3% |
| Immigrants | Spain | 47.0 /100 | #177 | Average 97.3% |
| Comanche | 42.1 /100 | #178 | Average 97.3% |
| Immigrants | Kenya | 40.3 /100 | #179 | Average 97.3% |
| Pakistanis | 40.2 /100 | #180 | Average 97.3% |
| Argentineans | 39.5 /100 | #181 | Fair 97.3% |
| Mongolians | 39.4 /100 | #182 | Fair 97.3% |
Demographics Similar to Burmese by 5th Grade
In terms of 5th grade, the demographic groups most similar to Burmese are Seminole (97.5%, a difference of 0.0%), Israeli (97.5%, a difference of 0.0%), Immigrants from Moldova (97.5%, a difference of 0.010%), Filipino (97.5%, a difference of 0.010%), and Blackfeet (97.5%, a difference of 0.010%).
| Demographics | Rating | Rank | 5th Grade |
| Cambodians | 90.2 /100 | #133 | Exceptional 97.6% |
| Immigrants | Hungary | 90.1 /100 | #134 | Exceptional 97.6% |
| Palestinians | 89.3 /100 | #135 | Excellent 97.5% |
| Immigrants | Moldova | 87.5 /100 | #136 | Excellent 97.5% |
| Filipinos | 86.8 /100 | #137 | Excellent 97.5% |
| Blackfeet | 86.8 /100 | #138 | Excellent 97.5% |
| Immigrants | Turkey | 86.7 /100 | #139 | Excellent 97.5% |
| Burmese | 86.1 /100 | #140 | Excellent 97.5% |
| Seminole | 85.8 /100 | #141 | Excellent 97.5% |
| Israelis | 85.5 /100 | #142 | Excellent 97.5% |
| Immigrants | North Macedonia | 85.4 /100 | #143 | Excellent 97.5% |
| Immigrants | Greece | 83.2 /100 | #144 | Excellent 97.5% |
| Jordanians | 82.6 /100 | #145 | Excellent 97.5% |
| Spaniards | 81.9 /100 | #146 | Excellent 97.5% |
| Soviet Union | 81.2 /100 | #147 | Excellent 97.5% |