Immigrants from Micronesia vs Crow 5th Grade
COMPARE
Immigrants from Micronesia
Crow
5th Grade
5th Grade Comparison
Immigrants from Micronesia
Crow
97.3%
5TH GRADE
48.8/ 100
METRIC RATING
175th/ 347
METRIC RANK
99.5%
5TH GRADE
100.0/ 100
METRIC RATING
1st/ 347
METRIC RANK
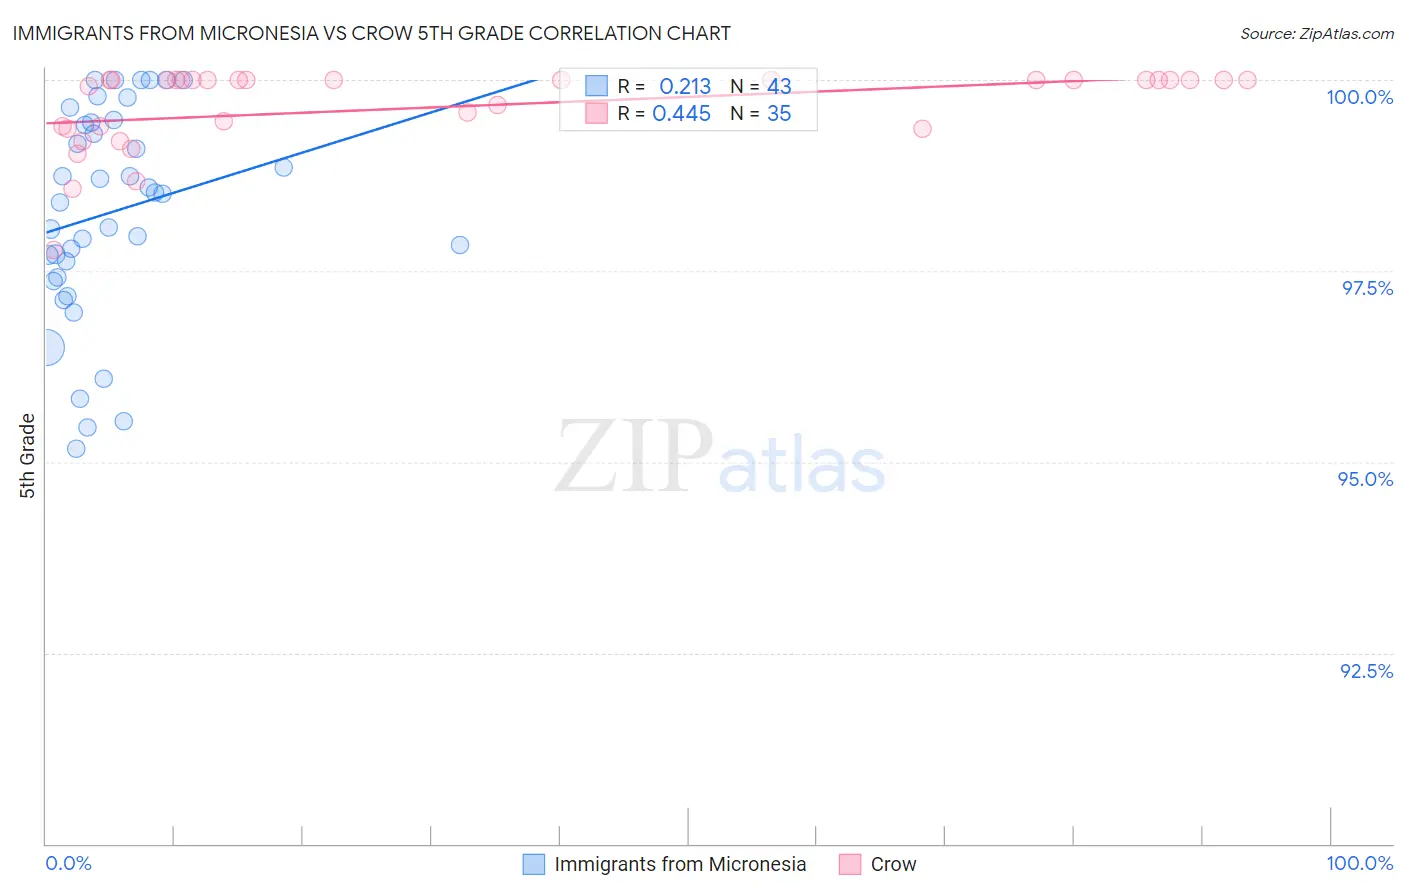
Immigrants from Micronesia vs Crow 5th Grade Correlation Chart
The statistical analysis conducted on geographies consisting of 61,604,657 people shows a weak positive correlation between the proportion of Immigrants from Micronesia and percentage of population with at least 5th grade education in the United States with a correlation coefficient (R) of 0.213 and weighted average of 97.3%. Similarly, the statistical analysis conducted on geographies consisting of 665,246 people shows a moderate positive correlation between the proportion of Crow and percentage of population with at least 5th grade education in the United States with a correlation coefficient (R) of 0.445 and weighted average of 99.5%, a difference of 2.2%.
5th Grade Correlation Summary
| Measurement | Immigrants from Micronesia | Crow |
| Minimum | 95.2% | 97.8% |
| Maximum | 100.0% | 100.0% |
| Range | 4.8% | 2.2% |
| Mean | 98.3% | 99.6% |
| Median | 98.5% | 100.0% |
| Interquartile 25% (IQ1) | 97.4% | 99.4% |
| Interquartile 75% (IQ3) | 99.4% | 100.0% |
| Interquartile Range (IQR) | 2.0% | 0.64% |
| Standard Deviation (Sample) | 1.4% | 0.53% |
| Standard Deviation (Population) | 1.4% | 0.52% |
Similar Demographics by 5th Grade
Demographics Similar to Immigrants from Micronesia by 5th Grade
In terms of 5th grade, the demographic groups most similar to Immigrants from Micronesia are Immigrants from Taiwan (97.3%, a difference of 0.0%), Egyptian (97.3%, a difference of 0.010%), Immigrants from Kazakhstan (97.3%, a difference of 0.010%), Immigrants from Spain (97.3%, a difference of 0.010%), and Chilean (97.3%, a difference of 0.020%).
| Demographics | Rating | Rank | 5th Grade |
| Chileans | 54.5 /100 | #168 | Average 97.3% |
| Immigrants | Korea | 54.1 /100 | #169 | Average 97.3% |
| Venezuelans | 54.0 /100 | #170 | Average 97.3% |
| Immigrants | Sri Lanka | 53.8 /100 | #171 | Average 97.3% |
| Arabs | 53.4 /100 | #172 | Average 97.3% |
| Egyptians | 52.4 /100 | #173 | Average 97.3% |
| Immigrants | Kazakhstan | 50.0 /100 | #174 | Average 97.3% |
| Immigrants | Micronesia | 48.8 /100 | #175 | Average 97.3% |
| Immigrants | Taiwan | 48.4 /100 | #176 | Average 97.3% |
| Immigrants | Spain | 47.0 /100 | #177 | Average 97.3% |
| Comanche | 42.1 /100 | #178 | Average 97.3% |
| Immigrants | Kenya | 40.3 /100 | #179 | Average 97.3% |
| Pakistanis | 40.2 /100 | #180 | Average 97.3% |
| Argentineans | 39.5 /100 | #181 | Fair 97.3% |
| Mongolians | 39.4 /100 | #182 | Fair 97.3% |
Demographics Similar to Crow by 5th Grade
In terms of 5th grade, the demographic groups most similar to Crow are Welsh (98.6%, a difference of 0.92%), Norwegian (98.4%, a difference of 1.1%), Tsimshian (98.4%, a difference of 1.1%), Slovak (98.4%, a difference of 1.1%), and German (98.4%, a difference of 1.1%).
| Demographics | Rating | Rank | 5th Grade |
| Crow | 100.0 /100 | #1 | Exceptional 99.5% |
| Welsh | 100.0 /100 | #2 | Exceptional 98.6% |
| Norwegians | 100.0 /100 | #3 | Exceptional 98.4% |
| Tsimshian | 100.0 /100 | #4 | Exceptional 98.4% |
| Slovaks | 100.0 /100 | #5 | Exceptional 98.4% |
| Germans | 100.0 /100 | #6 | Exceptional 98.4% |
| Inupiat | 100.0 /100 | #7 | Exceptional 98.4% |
| Slovenes | 100.0 /100 | #8 | Exceptional 98.3% |
| Swedes | 100.0 /100 | #9 | Exceptional 98.3% |
| English | 100.0 /100 | #10 | Exceptional 98.3% |
| Alaskan Athabascans | 100.0 /100 | #11 | Exceptional 98.3% |
| Carpatho Rusyns | 100.0 /100 | #12 | Exceptional 98.3% |
| Tlingit-Haida | 100.0 /100 | #13 | Exceptional 98.3% |
| Dutch | 100.0 /100 | #14 | Exceptional 98.3% |
| Scottish | 100.0 /100 | #15 | Exceptional 98.3% |