Immigrants from Liberia vs Cheyenne 6th Grade

COMPARE

Immigrants from Liberia
Race
Ancestry
AfghanAfricanAlaska NativeAlaskan AthabascanAlbanianAleutAlsatianAmericanApacheArabArapahoArgentineanArmenianAssyrian/Chaldean/SyriacAustralianAustrianBahamianBangladeshiBarbadianBasqueBelgianBelizeanBermudanBhutaneseBlackfeetBolivianBrazilianBritishBritish West IndianBulgarianBurmeseCajunCambodianCanadianCape VerdeanCarpatho RusynCelticCentral AmericanCentral American IndianCherokeeChickasawChileanChineseChippewaChoctawColombianColvilleComancheCosta RicanCreeCreekCroatianCrowCubanCypriotCzechCzechoslovakianDanishDelawareDominicanDutchDutch West IndianEastern EuropeanEcuadorianEgyptianEnglishEstonianEthiopianEuropeanFijianFilipinoFinnishFrenchFrench American IndianFrench CanadianGermanGerman RussianGhanaianGreekGuamanian/ChamorroGuatemalanGuyaneseHaitianHmongHonduranHopiHoumaHungarianIcelanderIndian (Asian)IndonesianInupiatIranianIraqiIrishIroquoisIsraeliItalianJamaicanJapaneseJordanianKenyanKiowaKoreanLaotianLatvianLebaneseLiberianLithuanianLumbeeLuxembourgerMacedonianMalaysianMalteseMarshalleseMenomineeMexicanMexican American IndianMongolianMoroccanNative HawaiianNavajoNepaleseNew ZealanderNicaraguanNigerianNorthern EuropeanNorwegianOkinawanOsageOttawaPaiutePakistaniPalestinianPanamanianParaguayanPennsylvania GermanPeruvianPimaPolishPortuguesePotawatomiPuebloPuerto RicanPuget Sound SalishRomanianRussianSalvadoranSamoanScandinavianScotch-IrishScottishSeminoleSenegaleseSerbianShoshoneSierra LeoneanSiouxSlavicSlovakSloveneSomaliSouth AfricanSouth AmericanSouth American IndianSoviet UnionSpaniardSpanishSpanish AmericanSpanish American IndianSri LankanSubsaharan AfricanSudaneseSwedishSwissSyrianTaiwaneseThaiTlingit-HaidaTohono O'OdhamTonganTrinidadian and TobagonianTsimshianTurkishU.S. Virgin IslanderUgandanUkrainianUruguayanUteVenezuelanVietnameseWelshWest IndianYakamaYaquiYugoslavianYumanYup'ikZimbabwean
Immigration
NonimmigrantsImmigrantsAfghanistanAfricaAlbaniaArgentinaArmeniaAsiaAustraliaAustriaBahamasBangladeshBarbadosBelarusBelgiumBelizeBoliviaBosnia and HerzegovinaBrazilBulgariaBurma/MyanmarCabo VerdeCambodiaCameroonCanadaCaribbeanCentral AmericaChileChinaColombiaCongoCosta RicaCroatiaCubaCzechoslovakiaDenmarkDominicaDominican RepublicEastern AfricaEastern AsiaEastern EuropeEcuadorEgyptEl SalvadorEnglandEritreaEthiopiaEuropeFijiFranceGermanyGhanaGreeceGrenadaGuatemalaGuyanaHaitiHondurasHong KongHungaryIndiaIndonesiaIranIraqIrelandIsraelItalyJamaicaJapanJordanKazakhstanKenyaKoreaKuwaitLaosLatin AmericaLatviaLebanonLiberiaLithuaniaMalaysiaMexicoMicronesiaMiddle AfricaMoldovaMoroccoNepalNetherlandsNicaraguaNigeriaNorth AmericaNorth MacedoniaNorthern AfricaNorthern EuropeNorwayOceaniaPakistanPanamaPeruPhilippinesPolandPortugalRomaniaRussiaSaudi ArabiaScotlandSenegalSerbiaSierra LeoneSingaporeSomaliaSouth AfricaSouth AmericaSouth Central AsiaSouth Eastern AsiaSouthern EuropeSpainSri LankaSt. Vincent and the GrenadinesSudanSwedenSwitzerlandSyriaTaiwanThailandTrinidad and TobagoTurkeyUgandaUkraineUruguayUzbekistanVenezuelaVietnamWest IndiesWestern AfricaWestern AsiaWestern EuropeYemenZaireZimbabweAzores
Cheyenne
Race
Ancestry
AfghanAfricanAlaska NativeAlaskan AthabascanAlbanianAleutAlsatianAmericanApacheArabArapahoArgentineanArmenianAssyrian/Chaldean/SyriacAustralianAustrianBahamianBangladeshiBarbadianBasqueBelgianBelizeanBermudanBhutaneseBlackfeetBolivianBrazilianBritishBritish West IndianBulgarianBurmeseCajunCambodianCanadianCape VerdeanCarpatho RusynCelticCentral AmericanCentral American IndianCherokeeCheyenneChickasawChileanChineseChippewaChoctawColombianColvilleComancheCosta RicanCreeCreekCroatianCrowCubanCypriotCzechCzechoslovakianDanishDelawareDominicanDutchDutch West IndianEastern EuropeanEcuadorianEgyptianEnglishEstonianEthiopianEuropeanFijianFilipinoFinnishFrenchFrench American IndianFrench CanadianGermanGerman RussianGhanaianGreekGuamanian/ChamorroGuatemalanGuyaneseHaitianHmongHonduranHopiHoumaHungarianIcelanderIndian (Asian)IndonesianInupiatIranianIraqiIrishIroquoisIsraeliItalianJamaicanJapaneseJordanianKenyanKiowaKoreanLaotianLatvianLebaneseLiberianLithuanianLumbeeLuxembourgerMacedonianMalaysianMalteseMarshalleseMenomineeMexicanMexican American IndianMongolianMoroccanNative HawaiianNavajoNepaleseNew ZealanderNicaraguanNigerianNorthern EuropeanNorwegianOkinawanOsageOttawaPaiutePakistaniPalestinianPanamanianParaguayanPennsylvania GermanPeruvianPimaPolishPortuguesePotawatomiPuebloPuerto RicanPuget Sound SalishRomanianRussianSalvadoranSamoanScandinavianScotch-IrishScottishSeminoleSenegaleseSerbianShoshoneSierra LeoneanSiouxSlavicSlovakSloveneSomaliSouth AfricanSouth AmericanSouth American IndianSoviet UnionSpaniardSpanishSpanish AmericanSpanish American IndianSri LankanSubsaharan AfricanSudaneseSwedishSwissSyrianTaiwaneseThaiTlingit-HaidaTohono O'OdhamTonganTrinidadian and TobagonianTsimshianTurkishU.S. Virgin IslanderUgandanUkrainianUruguayanUteVenezuelanVietnameseWelshWest IndianYakamaYaquiYugoslavianYumanYup'ikZimbabwean
Immigration
NonimmigrantsImmigrantsAfghanistanAfricaAlbaniaArgentinaArmeniaAsiaAustraliaAustriaBahamasBangladeshBarbadosBelarusBelgiumBelizeBoliviaBosnia and HerzegovinaBrazilBulgariaBurma/MyanmarCabo VerdeCambodiaCameroonCanadaCaribbeanCentral AmericaChileChinaColombiaCongoCosta RicaCroatiaCubaCzechoslovakiaDenmarkDominicaDominican RepublicEastern AfricaEastern AsiaEastern EuropeEcuadorEgyptEl SalvadorEnglandEritreaEthiopiaEuropeFijiFranceGermanyGhanaGreeceGrenadaGuatemalaGuyanaHaitiHondurasHong KongHungaryIndiaIndonesiaIranIraqIrelandIsraelItalyJamaicaJapanJordanKazakhstanKenyaKoreaKuwaitLaosLatin AmericaLatviaLebanonLithuaniaMalaysiaMexicoMicronesiaMiddle AfricaMoldovaMoroccoNepalNetherlandsNicaraguaNigeriaNorth AmericaNorth MacedoniaNorthern AfricaNorthern EuropeNorwayOceaniaPakistanPanamaPeruPhilippinesPolandPortugalRomaniaRussiaSaudi ArabiaScotlandSenegalSerbiaSierra LeoneSingaporeSomaliaSouth AfricaSouth AmericaSouth Central AsiaSouth Eastern AsiaSouthern EuropeSpainSri LankaSt. Vincent and the GrenadinesSudanSwedenSwitzerlandSyriaTaiwanThailandTrinidad and TobagoTurkeyUgandaUkraineUruguayUzbekistanVenezuelaVietnamWest IndiesWestern AfricaWestern AsiaWestern EuropeYemenZaireZimbabweAzores
6th Grade
Income
Poverty
Unemployment
Labor Participation
Family Structure
Vehicle Availability
Education Level
Disability

6th Grade Comparison

Immigrants from Liberia

Cheyenne

Tragic
Exceptional
96.6%
6TH GRADE
1.6/ 100
METRIC RATING
243rd/ 347
METRIC RANK
97.5%
6TH GRADE
97.9/ 100
METRIC RATING
105th/ 347
METRIC RANK

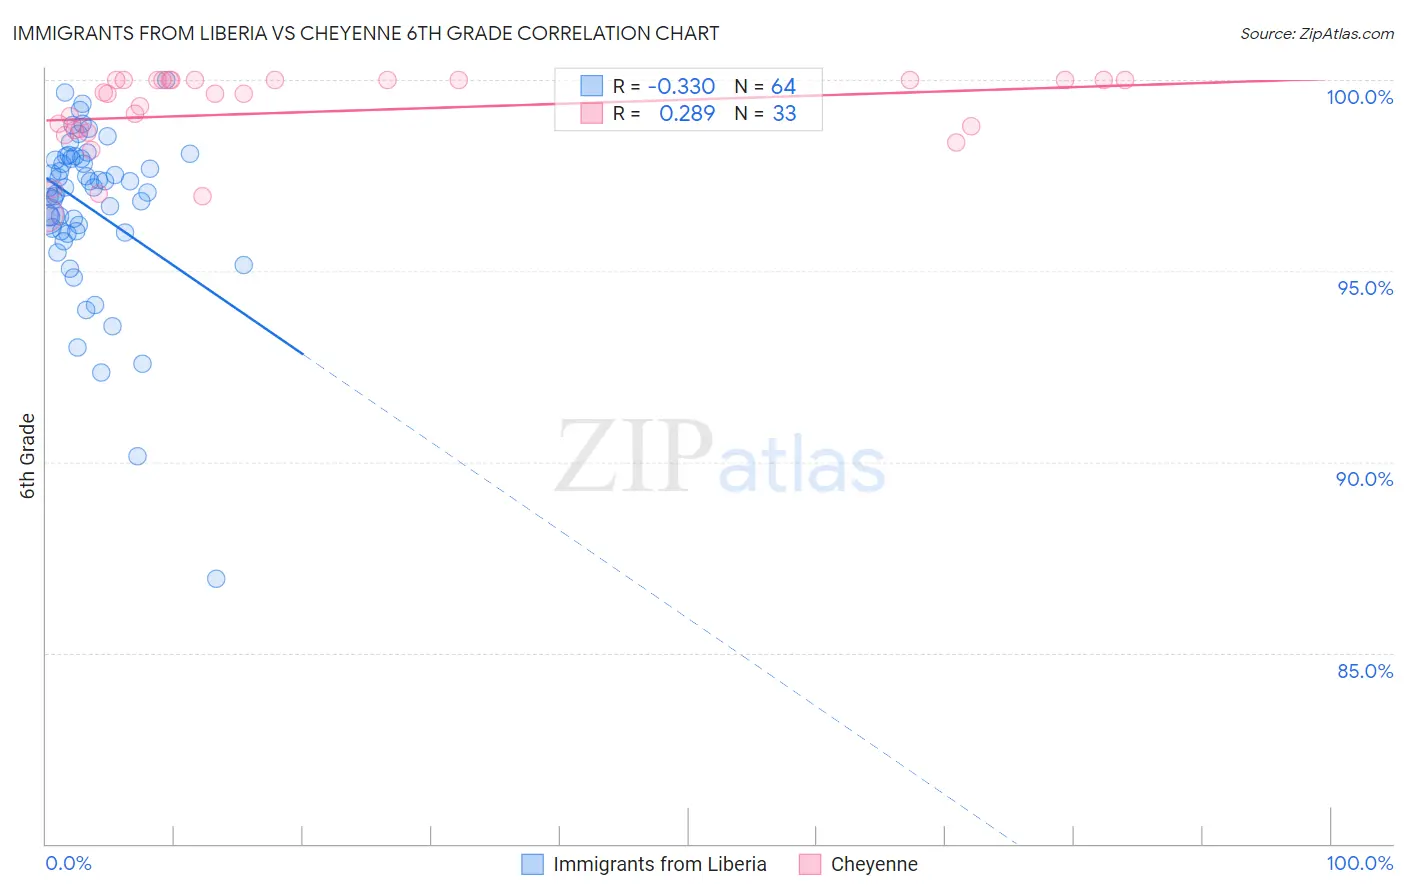
Immigrants from Liberia vs Cheyenne 6th Grade Correlation Chart

The statistical analysis conducted on geographies consisting of 135,294,272 people shows a mild negative correlation between the proportion of Immigrants from Liberia and percentage of population with at least 6th grade education in the United States with a correlation coefficient (R) of -0.330 and weighted average of 96.6%. Similarly, the statistical analysis conducted on geographies consisting of 80,716,760 people shows a weak positive correlation between the proportion of Cheyenne and percentage of population with at least 6th grade education in the United States with a correlation coefficient (R) of 0.289 and weighted average of 97.5%, a difference of 0.91%.
Immigrants from Liberia vs Cheyenne 6th Grade

6th Grade Correlation Summary

MeasurementImmigrants from LiberiaCheyenne
Minimum86.9%96.5%
Maximum100.0%100.0%
Range13.1%3.5%
Mean96.7%99.2%
Median97.2%99.6%
Interquartile 25% (IQ1)96.0%98.7%
Interquartile 75% (IQ3)97.9%100.0%
Interquartile Range (IQR)1.9%1.3%
Standard Deviation (Sample)2.2%1.0%
Standard Deviation (Population)2.2%1.0%

Similar Demographics by 6th Grade

Demographics Similar to Immigrants from Liberia by 6th Grade

In terms of 6th grade, the demographic groups most similar to Immigrants from Liberia are Senegalese (96.6%, a difference of 0.010%), Immigrants from Asia (96.6%, a difference of 0.010%), Ethiopian (96.6%, a difference of 0.010%), Nigerian (96.6%, a difference of 0.020%), and Indian (Asian) (96.6%, a difference of 0.020%).
DemographicsRating | Rank6th Grade
Immigrants | Indonesia
2.3
/100
|
#236
Tragic
96.6%
Immigrants | Eastern Africa
2.0
/100
|
#237
Tragic
96.6%
Nigerians
1.9
/100
|
#238
Tragic
96.6%
Indians (Asian)
1.9
/100
|
#239
Tragic
96.6%
Koreans
1.9
/100
|
#240
Tragic
96.6%
Senegalese
1.8
/100
|
#241
Tragic
96.6%
Immigrants | Asia
1.8
/100
|
#242
Tragic
96.6%
Immigrants | Liberia
1.6
/100
|
#243
Tragic
96.6%
Ethiopians
1.5
/100
|
#244
Tragic
96.6%
Immigrants | Costa Rica
1.3
/100
|
#245
Tragic
96.6%
Immigrants | Africa
1.3
/100
|
#246
Tragic
96.6%
Bolivians
1.0
/100
|
#247
Tragic
96.5%
Tohono O'odham
1.0
/100
|
#248
Tragic
96.5%
Colombians
0.9
/100
|
#249
Tragic
96.5%
Immigrants | Middle Africa
0.8
/100
|
#250
Tragic
96.5%

Demographics Similar to Cheyenne by 6th Grade

In terms of 6th grade, the demographic groups most similar to Cheyenne are Bhutanese (97.5%, a difference of 0.0%), German Russian (97.5%, a difference of 0.0%), Choctaw (97.5%, a difference of 0.010%), Menominee (97.5%, a difference of 0.010%), and Turkish (97.5%, a difference of 0.020%).
DemographicsRating | Rank6th Grade
Immigrants | Denmark
98.5
/100
|
#98
Exceptional
97.5%
Yugoslavians
98.5
/100
|
#99
Exceptional
97.5%
Turks
98.3
/100
|
#100
Exceptional
97.5%
South Africans
98.2
/100
|
#101
Exceptional
97.5%
Choctaw
98.0
/100
|
#102
Exceptional
97.5%
Bhutanese
98.0
/100
|
#103
Exceptional
97.5%
German Russians
97.9
/100
|
#104
Exceptional
97.5%
Cheyenne
97.9
/100
|
#105
Exceptional
97.5%
Menominee
97.7
/100
|
#106
Exceptional
97.5%
Immigrants | Singapore
97.6
/100
|
#107
Exceptional
97.5%
Immigrants | Nonimmigrants
97.3
/100
|
#108
Exceptional
97.4%
Immigrants | Czechoslovakia
97.3
/100
|
#109
Exceptional
97.4%
Thais
96.9
/100
|
#110
Exceptional
97.4%
Iroquois
96.9
/100
|
#111
Exceptional
97.4%
Immigrants | Latvia
96.7
/100
|
#112
Exceptional
97.4%