Immigrants from Liberia vs Immigrants from Europe 6th Grade
COMPARE
Immigrants from Liberia
Immigrants from Europe
6th Grade
6th Grade Comparison
Immigrants from Liberia
Immigrants from Europe
96.6%
6TH GRADE
1.6/ 100
METRIC RATING
243rd/ 347
METRIC RANK
97.3%
6TH GRADE
91.1/ 100
METRIC RATING
131st/ 347
METRIC RANK
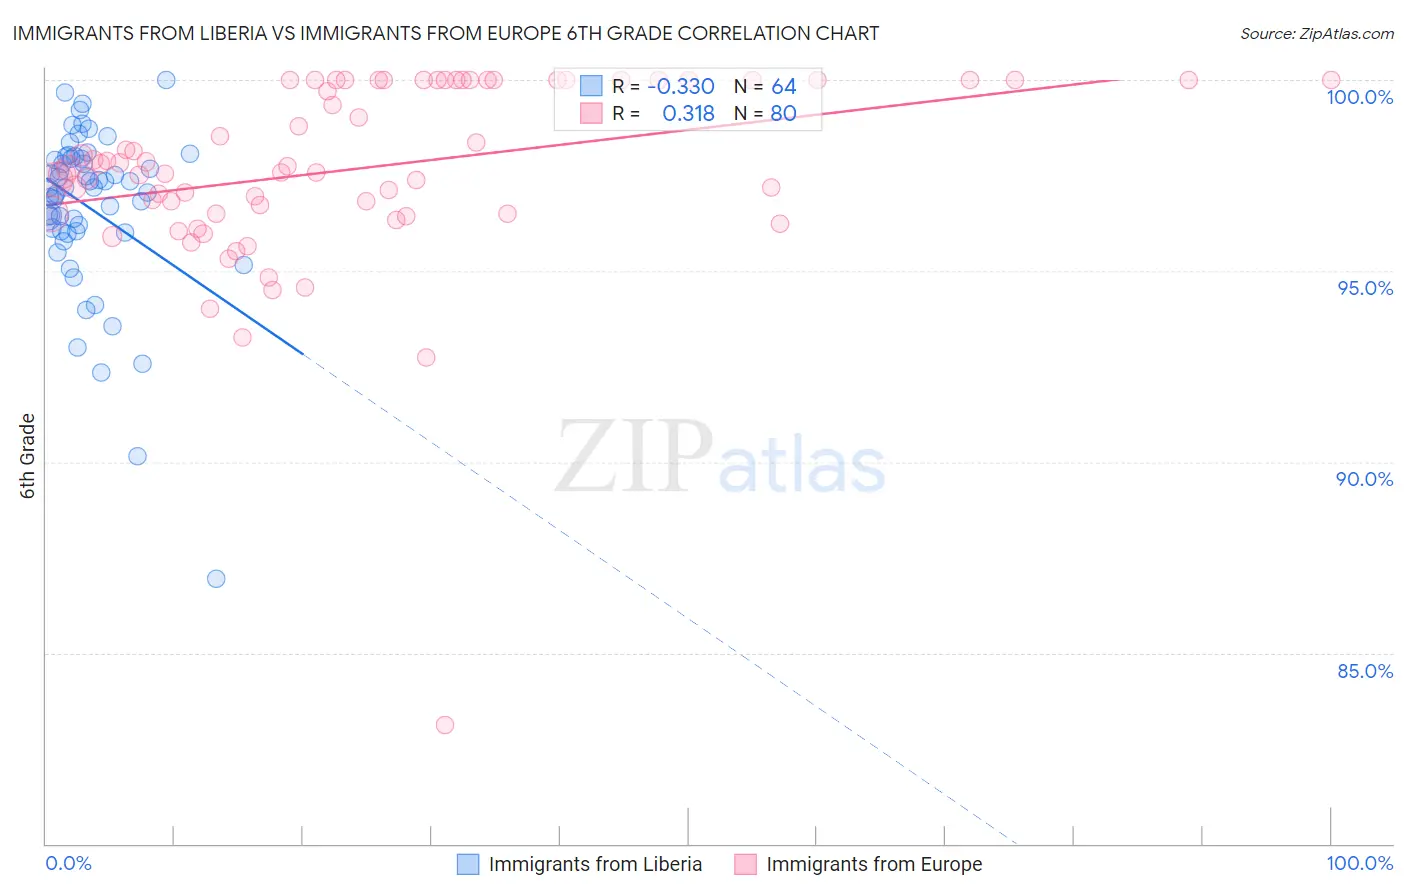
Immigrants from Liberia vs Immigrants from Europe 6th Grade Correlation Chart
The statistical analysis conducted on geographies consisting of 135,294,272 people shows a mild negative correlation between the proportion of Immigrants from Liberia and percentage of population with at least 6th grade education in the United States with a correlation coefficient (R) of -0.330 and weighted average of 96.6%. Similarly, the statistical analysis conducted on geographies consisting of 547,425,973 people shows a mild positive correlation between the proportion of Immigrants from Europe and percentage of population with at least 6th grade education in the United States with a correlation coefficient (R) of 0.318 and weighted average of 97.3%, a difference of 0.74%.
6th Grade Correlation Summary
| Measurement | Immigrants from Liberia | Immigrants from Europe |
| Minimum | 86.9% | 83.1% |
| Maximum | 100.0% | 100.0% |
| Range | 13.1% | 16.9% |
| Mean | 96.7% | 97.7% |
| Median | 97.2% | 97.7% |
| Interquartile 25% (IQ1) | 96.0% | 96.5% |
| Interquartile 75% (IQ3) | 97.9% | 100.0% |
| Interquartile Range (IQR) | 1.9% | 3.5% |
| Standard Deviation (Sample) | 2.2% | 2.5% |
| Standard Deviation (Population) | 2.2% | 2.5% |
Similar Demographics by 6th Grade
Demographics Similar to Immigrants from Liberia by 6th Grade
In terms of 6th grade, the demographic groups most similar to Immigrants from Liberia are Senegalese (96.6%, a difference of 0.010%), Immigrants from Asia (96.6%, a difference of 0.010%), Ethiopian (96.6%, a difference of 0.010%), Nigerian (96.6%, a difference of 0.020%), and Indian (Asian) (96.6%, a difference of 0.020%).
| Demographics | Rating | Rank | 6th Grade |
| Immigrants | Indonesia | 2.3 /100 | #236 | Tragic 96.6% |
| Immigrants | Eastern Africa | 2.0 /100 | #237 | Tragic 96.6% |
| Nigerians | 1.9 /100 | #238 | Tragic 96.6% |
| Indians (Asian) | 1.9 /100 | #239 | Tragic 96.6% |
| Koreans | 1.9 /100 | #240 | Tragic 96.6% |
| Senegalese | 1.8 /100 | #241 | Tragic 96.6% |
| Immigrants | Asia | 1.8 /100 | #242 | Tragic 96.6% |
| Immigrants | Liberia | 1.6 /100 | #243 | Tragic 96.6% |
| Ethiopians | 1.5 /100 | #244 | Tragic 96.6% |
| Immigrants | Costa Rica | 1.3 /100 | #245 | Tragic 96.6% |
| Immigrants | Africa | 1.3 /100 | #246 | Tragic 96.6% |
| Bolivians | 1.0 /100 | #247 | Tragic 96.5% |
| Tohono O'odham | 1.0 /100 | #248 | Tragic 96.5% |
| Colombians | 0.9 /100 | #249 | Tragic 96.5% |
| Immigrants | Middle Africa | 0.8 /100 | #250 | Tragic 96.5% |
Demographics Similar to Immigrants from Europe by 6th Grade
In terms of 6th grade, the demographic groups most similar to Immigrants from Europe are Palestinian (97.3%, a difference of 0.0%), Immigrants from Romania (97.3%, a difference of 0.010%), Immigrants from Serbia (97.3%, a difference of 0.010%), Cambodian (97.3%, a difference of 0.010%), and Immigrants from Moldova (97.3%, a difference of 0.010%).
| Demographics | Rating | Rank | 6th Grade |
| Okinawans | 94.2 /100 | #124 | Exceptional 97.4% |
| Spanish | 93.7 /100 | #125 | Exceptional 97.3% |
| Immigrants | Bulgaria | 93.6 /100 | #126 | Exceptional 97.3% |
| Immigrants | Croatia | 93.1 /100 | #127 | Exceptional 97.3% |
| Immigrants | Romania | 92.0 /100 | #128 | Exceptional 97.3% |
| Immigrants | Serbia | 91.9 /100 | #129 | Exceptional 97.3% |
| Cambodians | 91.8 /100 | #130 | Exceptional 97.3% |
| Immigrants | Europe | 91.1 /100 | #131 | Exceptional 97.3% |
| Palestinians | 90.9 /100 | #132 | Exceptional 97.3% |
| Immigrants | Moldova | 90.0 /100 | #133 | Excellent 97.3% |
| Immigrants | Kuwait | 89.5 /100 | #134 | Excellent 97.3% |
| Immigrants | Hungary | 89.5 /100 | #135 | Excellent 97.3% |
| Filipinos | 88.9 /100 | #136 | Excellent 97.3% |
| Burmese | 87.8 /100 | #137 | Excellent 97.3% |
| Blackfeet | 87.7 /100 | #138 | Excellent 97.3% |