Egyptian vs Cheyenne 6th Grade

COMPARE

Egyptian
Race
Ancestry
AfghanAfricanAlaska NativeAlaskan AthabascanAlbanianAleutAlsatianAmericanApacheArabArapahoArgentineanArmenianAssyrian/Chaldean/SyriacAustralianAustrianBahamianBangladeshiBarbadianBasqueBelgianBelizeanBermudanBhutaneseBlackfeetBolivianBrazilianBritishBritish West IndianBulgarianBurmeseCajunCambodianCanadianCape VerdeanCarpatho RusynCelticCentral AmericanCentral American IndianCherokeeChickasawChileanChineseChippewaChoctawColombianColvilleComancheCosta RicanCreeCreekCroatianCrowCubanCypriotCzechCzechoslovakianDanishDelawareDominicanDutchDutch West IndianEastern EuropeanEcuadorianEgyptianEnglishEstonianEthiopianEuropeanFijianFilipinoFinnishFrenchFrench American IndianFrench CanadianGermanGerman RussianGhanaianGreekGuamanian/ChamorroGuatemalanGuyaneseHaitianHmongHonduranHopiHoumaHungarianIcelanderIndian (Asian)IndonesianInupiatIranianIraqiIrishIroquoisIsraeliItalianJamaicanJapaneseJordanianKenyanKiowaKoreanLaotianLatvianLebaneseLiberianLithuanianLumbeeLuxembourgerMacedonianMalaysianMalteseMarshalleseMenomineeMexicanMexican American IndianMongolianMoroccanNative HawaiianNavajoNepaleseNew ZealanderNicaraguanNigerianNorthern EuropeanNorwegianOkinawanOsageOttawaPaiutePakistaniPalestinianPanamanianParaguayanPennsylvania GermanPeruvianPimaPolishPortuguesePotawatomiPuebloPuerto RicanPuget Sound SalishRomanianRussianSalvadoranSamoanScandinavianScotch-IrishScottishSeminoleSenegaleseSerbianShoshoneSierra LeoneanSiouxSlavicSlovakSloveneSomaliSouth AfricanSouth AmericanSouth American IndianSoviet UnionSpaniardSpanishSpanish AmericanSpanish American IndianSri LankanSubsaharan AfricanSudaneseSwedishSwissSyrianTaiwaneseThaiTlingit-HaidaTohono O'OdhamTonganTrinidadian and TobagonianTsimshianTurkishU.S. Virgin IslanderUgandanUkrainianUruguayanUteVenezuelanVietnameseWelshWest IndianYakamaYaquiYugoslavianYumanYup'ikZimbabwean
Immigration
NonimmigrantsImmigrantsAfghanistanAfricaAlbaniaArgentinaArmeniaAsiaAustraliaAustriaBahamasBangladeshBarbadosBelarusBelgiumBelizeBoliviaBosnia and HerzegovinaBrazilBulgariaBurma/MyanmarCabo VerdeCambodiaCameroonCanadaCaribbeanCentral AmericaChileChinaColombiaCongoCosta RicaCroatiaCubaCzechoslovakiaDenmarkDominicaDominican RepublicEastern AfricaEastern AsiaEastern EuropeEcuadorEgyptEl SalvadorEnglandEritreaEthiopiaEuropeFijiFranceGermanyGhanaGreeceGrenadaGuatemalaGuyanaHaitiHondurasHong KongHungaryIndiaIndonesiaIranIraqIrelandIsraelItalyJamaicaJapanJordanKazakhstanKenyaKoreaKuwaitLaosLatin AmericaLatviaLebanonLiberiaLithuaniaMalaysiaMexicoMicronesiaMiddle AfricaMoldovaMoroccoNepalNetherlandsNicaraguaNigeriaNorth AmericaNorth MacedoniaNorthern AfricaNorthern EuropeNorwayOceaniaPakistanPanamaPeruPhilippinesPolandPortugalRomaniaRussiaSaudi ArabiaScotlandSenegalSerbiaSierra LeoneSingaporeSomaliaSouth AfricaSouth AmericaSouth Central AsiaSouth Eastern AsiaSouthern EuropeSpainSri LankaSt. Vincent and the GrenadinesSudanSwedenSwitzerlandSyriaTaiwanThailandTrinidad and TobagoTurkeyUgandaUkraineUruguayUzbekistanVenezuelaVietnamWest IndiesWestern AfricaWestern AsiaWestern EuropeYemenZaireZimbabweAzores
Cheyenne
Race
Ancestry
AfghanAfricanAlaska NativeAlaskan AthabascanAlbanianAleutAlsatianAmericanApacheArabArapahoArgentineanArmenianAssyrian/Chaldean/SyriacAustralianAustrianBahamianBangladeshiBarbadianBasqueBelgianBelizeanBermudanBhutaneseBlackfeetBolivianBrazilianBritishBritish West IndianBulgarianBurmeseCajunCambodianCanadianCape VerdeanCarpatho RusynCelticCentral AmericanCentral American IndianCherokeeCheyenneChickasawChileanChineseChippewaChoctawColombianColvilleComancheCosta RicanCreeCreekCroatianCrowCubanCypriotCzechCzechoslovakianDanishDelawareDominicanDutchDutch West IndianEastern EuropeanEcuadorianEnglishEstonianEthiopianEuropeanFijianFilipinoFinnishFrenchFrench American IndianFrench CanadianGermanGerman RussianGhanaianGreekGuamanian/ChamorroGuatemalanGuyaneseHaitianHmongHonduranHopiHoumaHungarianIcelanderIndian (Asian)IndonesianInupiatIranianIraqiIrishIroquoisIsraeliItalianJamaicanJapaneseJordanianKenyanKiowaKoreanLaotianLatvianLebaneseLiberianLithuanianLumbeeLuxembourgerMacedonianMalaysianMalteseMarshalleseMenomineeMexicanMexican American IndianMongolianMoroccanNative HawaiianNavajoNepaleseNew ZealanderNicaraguanNigerianNorthern EuropeanNorwegianOkinawanOsageOttawaPaiutePakistaniPalestinianPanamanianParaguayanPennsylvania GermanPeruvianPimaPolishPortuguesePotawatomiPuebloPuerto RicanPuget Sound SalishRomanianRussianSalvadoranSamoanScandinavianScotch-IrishScottishSeminoleSenegaleseSerbianShoshoneSierra LeoneanSiouxSlavicSlovakSloveneSomaliSouth AfricanSouth AmericanSouth American IndianSoviet UnionSpaniardSpanishSpanish AmericanSpanish American IndianSri LankanSubsaharan AfricanSudaneseSwedishSwissSyrianTaiwaneseThaiTlingit-HaidaTohono O'OdhamTonganTrinidadian and TobagonianTsimshianTurkishU.S. Virgin IslanderUgandanUkrainianUruguayanUteVenezuelanVietnameseWelshWest IndianYakamaYaquiYugoslavianYumanYup'ikZimbabwean
Immigration
NonimmigrantsImmigrantsAfghanistanAfricaAlbaniaArgentinaArmeniaAsiaAustraliaAustriaBahamasBangladeshBarbadosBelarusBelgiumBelizeBoliviaBosnia and HerzegovinaBrazilBulgariaBurma/MyanmarCabo VerdeCambodiaCameroonCanadaCaribbeanCentral AmericaChileChinaColombiaCongoCosta RicaCroatiaCubaCzechoslovakiaDenmarkDominicaDominican RepublicEastern AfricaEastern AsiaEastern EuropeEcuadorEgyptEl SalvadorEnglandEritreaEthiopiaEuropeFijiFranceGermanyGhanaGreeceGrenadaGuatemalaGuyanaHaitiHondurasHong KongHungaryIndiaIndonesiaIranIraqIrelandIsraelItalyJamaicaJapanJordanKazakhstanKenyaKoreaKuwaitLaosLatin AmericaLatviaLebanonLiberiaLithuaniaMalaysiaMexicoMicronesiaMiddle AfricaMoldovaMoroccoNepalNetherlandsNicaraguaNigeriaNorth AmericaNorth MacedoniaNorthern AfricaNorthern EuropeNorwayOceaniaPakistanPanamaPeruPhilippinesPolandPortugalRomaniaRussiaSaudi ArabiaScotlandSenegalSerbiaSierra LeoneSingaporeSomaliaSouth AfricaSouth AmericaSouth Central AsiaSouth Eastern AsiaSouthern EuropeSpainSri LankaSt. Vincent and the GrenadinesSudanSwedenSwitzerlandSyriaTaiwanThailandTrinidad and TobagoTurkeyUgandaUkraineUruguayUzbekistanVenezuelaVietnamWest IndiesWestern AfricaWestern AsiaWestern EuropeYemenZaireZimbabweAzores
6th Grade
Income
Poverty
Unemployment
Labor Participation
Family Structure
Vehicle Availability
Education Level
Disability

6th Grade Comparison

Egyptians

Cheyenne

Average
Exceptional
97.1%
6TH GRADE
50.9/ 100
METRIC RATING
172nd/ 347
METRIC RANK
97.5%
6TH GRADE
97.9/ 100
METRIC RATING
105th/ 347
METRIC RANK

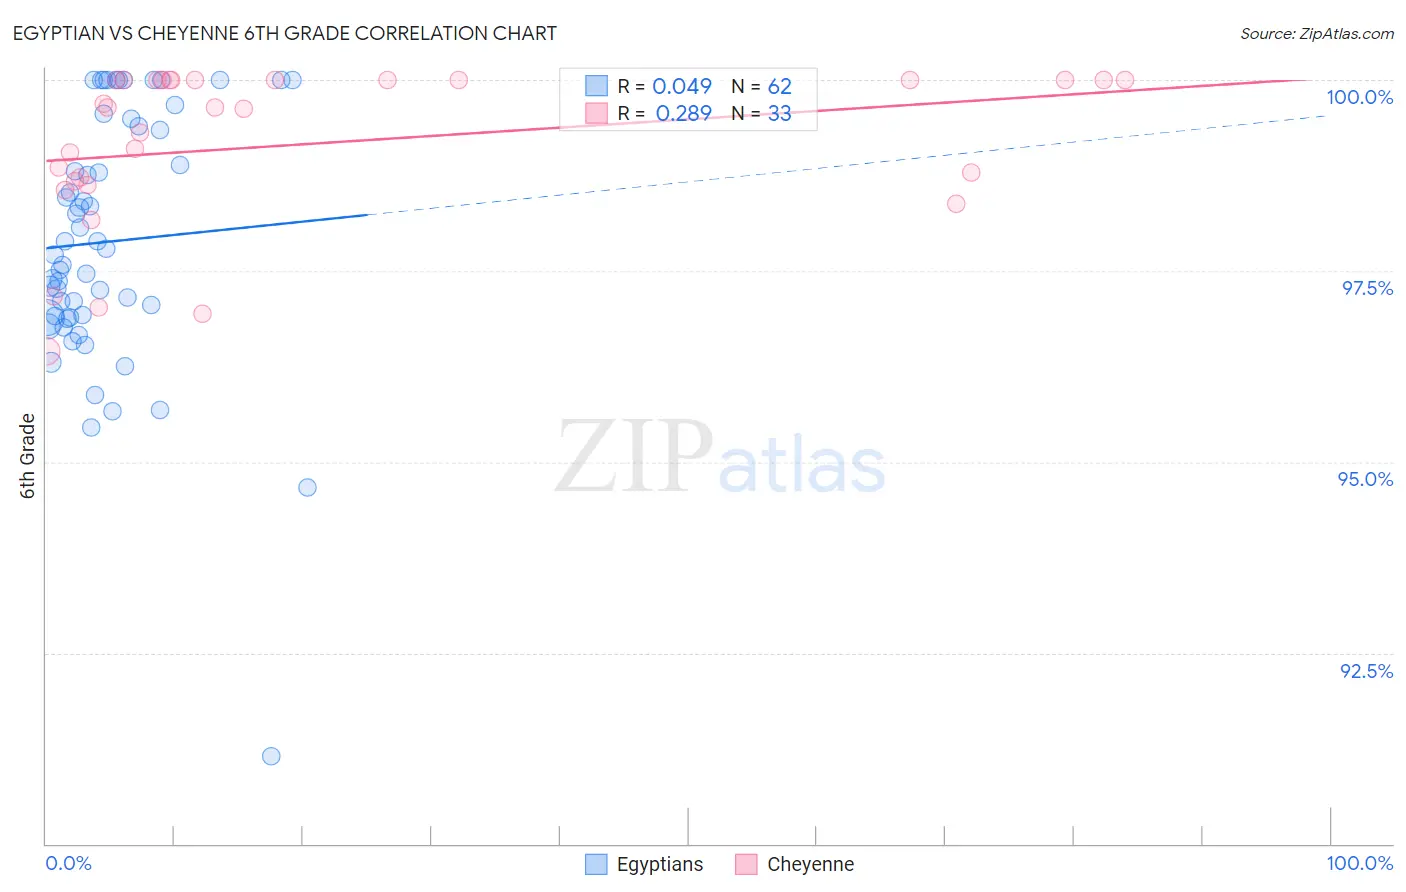
Egyptian vs Cheyenne 6th Grade Correlation Chart

The statistical analysis conducted on geographies consisting of 276,927,423 people shows no correlation between the proportion of Egyptians and percentage of population with at least 6th grade education in the United States with a correlation coefficient (R) of 0.049 and weighted average of 97.1%. Similarly, the statistical analysis conducted on geographies consisting of 80,716,760 people shows a weak positive correlation between the proportion of Cheyenne and percentage of population with at least 6th grade education in the United States with a correlation coefficient (R) of 0.289 and weighted average of 97.5%, a difference of 0.43%.
Egyptian vs Cheyenne 6th Grade

6th Grade Correlation Summary

MeasurementEgyptianCheyenne
Minimum91.1%96.5%
Maximum100.0%100.0%
Range8.9%3.5%
Mean97.9%99.2%
Median97.8%99.6%
Interquartile 25% (IQ1)96.9%98.7%
Interquartile 75% (IQ3)99.4%100.0%
Interquartile Range (IQR)2.5%1.3%
Standard Deviation (Sample)1.7%1.0%
Standard Deviation (Population)1.7%1.0%

Similar Demographics by 6th Grade

Demographics Similar to Egyptians by 6th Grade

In terms of 6th grade, the demographic groups most similar to Egyptians are Immigrants from Sri Lanka (97.1%, a difference of 0.0%), Arab (97.0%, a difference of 0.0%), Venezuelan (97.0%, a difference of 0.0%), Immigrants from Italy (97.1%, a difference of 0.010%), and Apache (97.1%, a difference of 0.010%).
DemographicsRating | Rank6th Grade
Immigrants | Poland
56.2
/100
|
#165
Average
97.1%
Immigrants | Italy
53.8
/100
|
#166
Average
97.1%
Apache
53.6
/100
|
#167
Average
97.1%
Immigrants | Taiwan
53.5
/100
|
#168
Average
97.1%
Bermudans
52.6
/100
|
#169
Average
97.1%
Chileans
52.1
/100
|
#170
Average
97.1%
Immigrants | Sri Lanka
51.7
/100
|
#171
Average
97.1%
Egyptians
50.9
/100
|
#172
Average
97.1%
Arabs
50.1
/100
|
#173
Average
97.0%
Venezuelans
50.0
/100
|
#174
Average
97.0%
Immigrants | Kazakhstan
47.3
/100
|
#175
Average
97.0%
Immigrants | Micronesia
47.1
/100
|
#176
Average
97.0%
Mongolians
46.7
/100
|
#177
Average
97.0%
Pakistanis
46.0
/100
|
#178
Average
97.0%
Immigrants | Kenya
45.3
/100
|
#179
Average
97.0%

Demographics Similar to Cheyenne by 6th Grade

In terms of 6th grade, the demographic groups most similar to Cheyenne are Bhutanese (97.5%, a difference of 0.0%), German Russian (97.5%, a difference of 0.0%), Choctaw (97.5%, a difference of 0.010%), Menominee (97.5%, a difference of 0.010%), and Turkish (97.5%, a difference of 0.020%).
DemographicsRating | Rank6th Grade
Immigrants | Denmark
98.5
/100
|
#98
Exceptional
97.5%
Yugoslavians
98.5
/100
|
#99
Exceptional
97.5%
Turks
98.3
/100
|
#100
Exceptional
97.5%
South Africans
98.2
/100
|
#101
Exceptional
97.5%
Choctaw
98.0
/100
|
#102
Exceptional
97.5%
Bhutanese
98.0
/100
|
#103
Exceptional
97.5%
German Russians
97.9
/100
|
#104
Exceptional
97.5%
Cheyenne
97.9
/100
|
#105
Exceptional
97.5%
Menominee
97.7
/100
|
#106
Exceptional
97.5%
Immigrants | Singapore
97.6
/100
|
#107
Exceptional
97.5%
Immigrants | Nonimmigrants
97.3
/100
|
#108
Exceptional
97.4%
Immigrants | Czechoslovakia
97.3
/100
|
#109
Exceptional
97.4%
Thais
96.9
/100
|
#110
Exceptional
97.4%
Iroquois
96.9
/100
|
#111
Exceptional
97.4%
Immigrants | Latvia
96.7
/100
|
#112
Exceptional
97.4%