Immigrants from Korea vs British No Schooling Completed
COMPARE
Immigrants from Korea
British
No Schooling Completed
No Schooling Completed Comparison
Immigrants from Korea
British
2.0%
NO SCHOOLING COMPLETED
66.7/ 100
METRIC RATING
158th/ 347
METRIC RANK
1.5%
NO SCHOOLING COMPLETED
100.0/ 100
METRIC RATING
30th/ 347
METRIC RANK
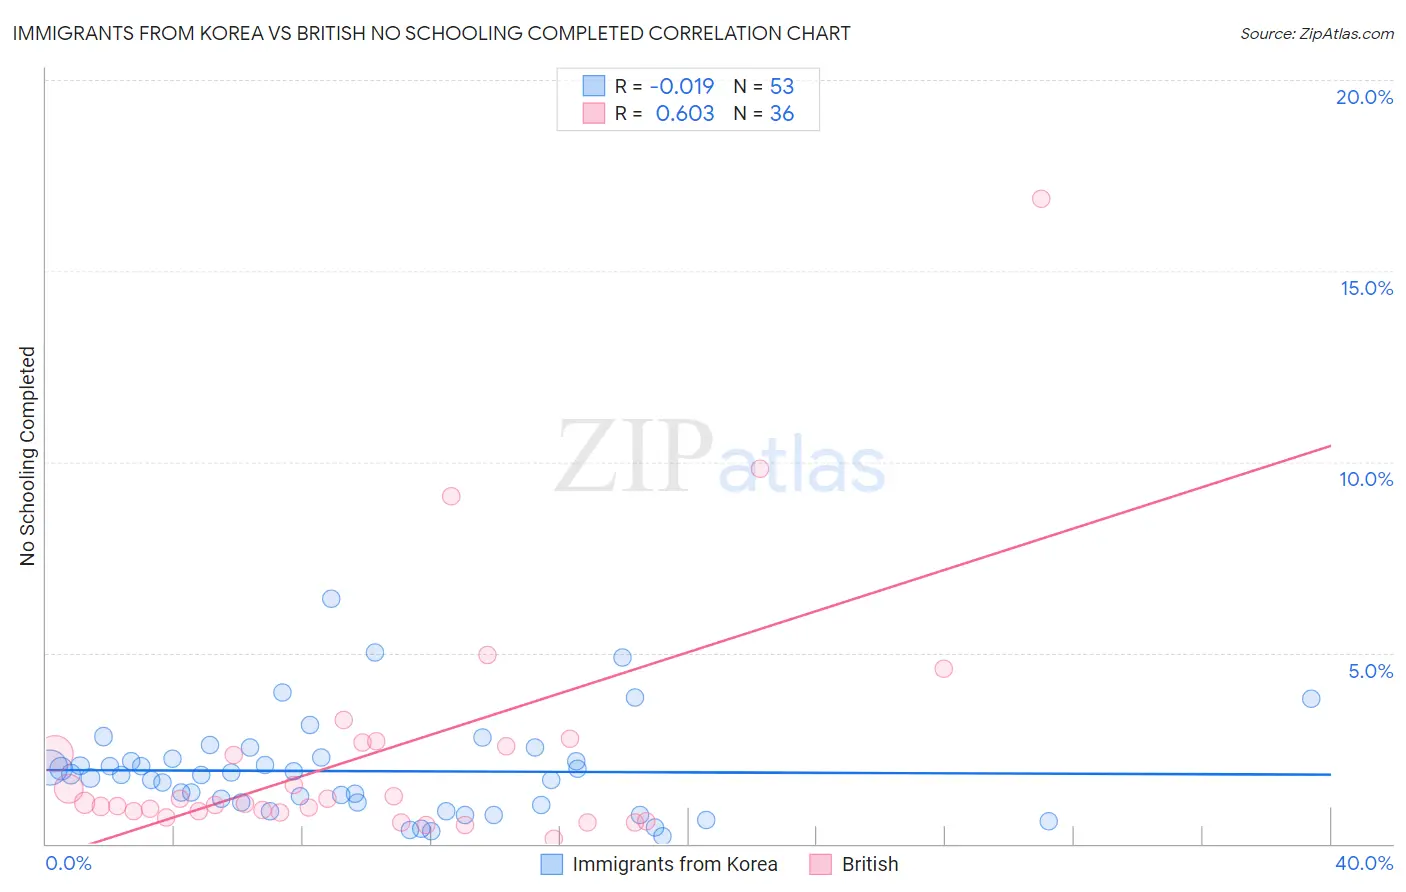
Immigrants from Korea vs British No Schooling Completed Correlation Chart
The statistical analysis conducted on geographies consisting of 411,278,726 people shows no correlation between the proportion of Immigrants from Korea and percentage of population with no schooling in the United States with a correlation coefficient (R) of -0.019 and weighted average of 2.0%. Similarly, the statistical analysis conducted on geographies consisting of 518,649,413 people shows a significant positive correlation between the proportion of British and percentage of population with no schooling in the United States with a correlation coefficient (R) of 0.603 and weighted average of 1.5%, a difference of 34.2%.
No Schooling Completed Correlation Summary
| Measurement | Immigrants from Korea | British |
| Minimum | 0.20% | 0.14% |
| Maximum | 6.4% | 16.9% |
| Range | 6.2% | 16.8% |
| Mean | 1.9% | 2.4% |
| Median | 1.8% | 1.1% |
| Interquartile 25% (IQ1) | 1.0% | 0.83% |
| Interquartile 75% (IQ3) | 2.2% | 2.6% |
| Interquartile Range (IQR) | 1.2% | 1.8% |
| Standard Deviation (Sample) | 1.3% | 3.3% |
| Standard Deviation (Population) | 1.2% | 3.3% |
Similar Demographics by No Schooling Completed
Demographics Similar to Immigrants from Korea by No Schooling Completed
In terms of no schooling completed, the demographic groups most similar to Immigrants from Korea are Immigrants from Sri Lanka (2.0%, a difference of 0.040%), Immigrants from Spain (2.0%, a difference of 0.050%), Chilean (2.0%, a difference of 0.080%), Immigrants from Russia (2.0%, a difference of 0.14%), and Kenyan (2.0%, a difference of 0.16%).
| Demographics | Rating | Rank | No Schooling Completed |
| Immigrants | Jordan | 70.9 /100 | #151 | Good 2.0% |
| Immigrants | Eastern Europe | 70.4 /100 | #152 | Good 2.0% |
| Immigrants | Italy | 68.9 /100 | #153 | Good 2.0% |
| Immigrants | Venezuela | 68.5 /100 | #154 | Good 2.0% |
| Immigrants | Russia | 67.6 /100 | #155 | Good 2.0% |
| Chileans | 67.2 /100 | #156 | Good 2.0% |
| Immigrants | Sri Lanka | 67.0 /100 | #157 | Good 2.0% |
| Immigrants | Korea | 66.7 /100 | #158 | Good 2.0% |
| Immigrants | Spain | 66.4 /100 | #159 | Good 2.0% |
| Kenyans | 65.7 /100 | #160 | Good 2.0% |
| Ugandans | 64.6 /100 | #161 | Good 2.0% |
| Immigrants | Brazil | 63.8 /100 | #162 | Good 2.1% |
| Albanians | 62.2 /100 | #163 | Good 2.1% |
| Comanche | 60.7 /100 | #164 | Good 2.1% |
| Brazilians | 60.2 /100 | #165 | Good 2.1% |
Demographics Similar to British by No Schooling Completed
In terms of no schooling completed, the demographic groups most similar to British are Inupiat (1.5%, a difference of 0.030%), Swiss (1.5%, a difference of 0.42%), Lumbee (1.5%, a difference of 0.48%), Italian (1.5%, a difference of 1.1%), and Latvian (1.5%, a difference of 1.4%).
| Demographics | Rating | Rank | No Schooling Completed |
| Europeans | 100.0 /100 | #23 | Exceptional 1.5% |
| Pennsylvania Germans | 100.0 /100 | #24 | Exceptional 1.5% |
| French | 100.0 /100 | #25 | Exceptional 1.5% |
| Czechs | 100.0 /100 | #26 | Exceptional 1.5% |
| Scandinavians | 100.0 /100 | #27 | Exceptional 1.5% |
| French Canadians | 100.0 /100 | #28 | Exceptional 1.5% |
| Lumbee | 100.0 /100 | #29 | Exceptional 1.5% |
| British | 100.0 /100 | #30 | Exceptional 1.5% |
| Inupiat | 100.0 /100 | #31 | Exceptional 1.5% |
| Swiss | 100.0 /100 | #32 | Exceptional 1.5% |
| Italians | 100.0 /100 | #33 | Exceptional 1.5% |
| Latvians | 100.0 /100 | #34 | Exceptional 1.5% |
| Eastern Europeans | 100.0 /100 | #35 | Exceptional 1.6% |
| Aleuts | 99.9 /100 | #36 | Exceptional 1.6% |
| Belgians | 99.9 /100 | #37 | Exceptional 1.6% |