Immigrants from Korea vs British Seniors Poverty Over the Age of 75
COMPARE
Immigrants from Korea
British
Seniors Poverty Over the Age of 75
Seniors Poverty Over the Age of 75 Comparison
Immigrants from Korea
British
12.0%
SENIORS POVERTY OVER THE AGE OF 75
65.5/ 100
METRIC RATING
152nd/ 347
METRIC RANK
10.7%
SENIORS POVERTY OVER THE AGE OF 75
99.7/ 100
METRIC RATING
32nd/ 347
METRIC RANK
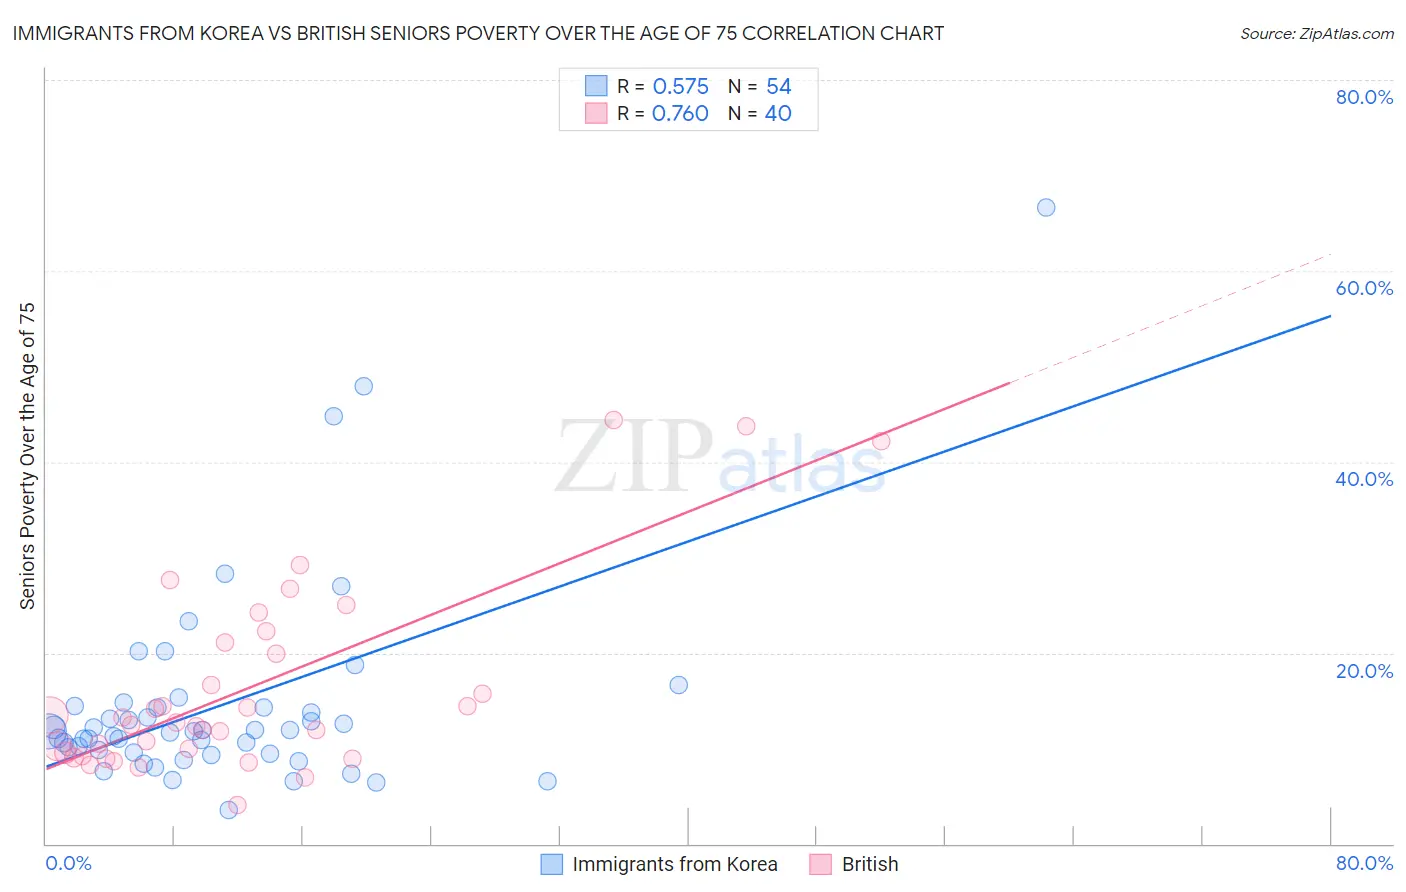
Immigrants from Korea vs British Seniors Poverty Over the Age of 75 Correlation Chart
The statistical analysis conducted on geographies consisting of 410,560,504 people shows a substantial positive correlation between the proportion of Immigrants from Korea and poverty level among seniors over the age of 75 in the United States with a correlation coefficient (R) of 0.575 and weighted average of 12.0%. Similarly, the statistical analysis conducted on geographies consisting of 519,626,577 people shows a strong positive correlation between the proportion of British and poverty level among seniors over the age of 75 in the United States with a correlation coefficient (R) of 0.760 and weighted average of 10.7%, a difference of 11.9%.
Seniors Poverty Over the Age of 75 Correlation Summary
| Measurement | Immigrants from Korea | British |
| Minimum | 3.6% | 4.0% |
| Maximum | 66.7% | 44.4% |
| Range | 63.1% | 40.4% |
| Mean | 14.5% | 16.2% |
| Median | 11.8% | 12.6% |
| Interquartile 25% (IQ1) | 9.6% | 9.4% |
| Interquartile 75% (IQ3) | 14.3% | 20.5% |
| Interquartile Range (IQR) | 4.7% | 11.2% |
| Standard Deviation (Sample) | 10.8% | 9.9% |
| Standard Deviation (Population) | 10.7% | 9.8% |
Similar Demographics by Seniors Poverty Over the Age of 75
Demographics Similar to Immigrants from Korea by Seniors Poverty Over the Age of 75
In terms of seniors poverty over the age of 75, the demographic groups most similar to Immigrants from Korea are Cherokee (12.0%, a difference of 0.030%), Immigrants from Turkey (12.0%, a difference of 0.080%), Cambodian (12.0%, a difference of 0.14%), Cypriot (12.0%, a difference of 0.17%), and Asian (12.0%, a difference of 0.18%).
| Demographics | Rating | Rank | Seniors Poverty Over the Age of 75 |
| Immigrants | Belgium | 70.8 /100 | #145 | Good 12.0% |
| Bangladeshis | 70.4 /100 | #146 | Good 12.0% |
| Immigrants | Latvia | 69.1 /100 | #147 | Good 12.0% |
| Immigrants | Zaire | 67.6 /100 | #148 | Good 12.0% |
| Asians | 67.4 /100 | #149 | Good 12.0% |
| Cypriots | 67.3 /100 | #150 | Good 12.0% |
| Cherokee | 65.8 /100 | #151 | Good 12.0% |
| Immigrants | Korea | 65.5 /100 | #152 | Good 12.0% |
| Immigrants | Turkey | 64.7 /100 | #153 | Good 12.0% |
| Cambodians | 64.0 /100 | #154 | Good 12.0% |
| Indonesians | 62.6 /100 | #155 | Good 12.1% |
| Immigrants | Burma/Myanmar | 62.3 /100 | #156 | Good 12.1% |
| Immigrants | Sudan | 61.7 /100 | #157 | Good 12.1% |
| Portuguese | 61.3 /100 | #158 | Good 12.1% |
| Immigrants | Middle Africa | 61.2 /100 | #159 | Good 12.1% |
Demographics Similar to British by Seniors Poverty Over the Age of 75
In terms of seniors poverty over the age of 75, the demographic groups most similar to British are Puget Sound Salish (10.8%, a difference of 0.060%), Italian (10.8%, a difference of 0.11%), Marshallese (10.7%, a difference of 0.14%), Swiss (10.7%, a difference of 0.32%), and Assyrian/Chaldean/Syriac (10.7%, a difference of 0.40%).
| Demographics | Rating | Rank | Seniors Poverty Over the Age of 75 |
| Menominee | 99.8 /100 | #25 | Exceptional 10.6% |
| Bulgarians | 99.8 /100 | #26 | Exceptional 10.7% |
| Northern Europeans | 99.8 /100 | #27 | Exceptional 10.7% |
| Irish | 99.8 /100 | #28 | Exceptional 10.7% |
| Assyrians/Chaldeans/Syriacs | 99.8 /100 | #29 | Exceptional 10.7% |
| Swiss | 99.7 /100 | #30 | Exceptional 10.7% |
| Marshallese | 99.7 /100 | #31 | Exceptional 10.7% |
| British | 99.7 /100 | #32 | Exceptional 10.7% |
| Puget Sound Salish | 99.7 /100 | #33 | Exceptional 10.8% |
| Italians | 99.7 /100 | #34 | Exceptional 10.8% |
| Luxembourgers | 99.6 /100 | #35 | Exceptional 10.8% |
| Scotch-Irish | 99.6 /100 | #36 | Exceptional 10.8% |
| Latvians | 99.6 /100 | #37 | Exceptional 10.8% |
| Finns | 99.6 /100 | #38 | Exceptional 10.8% |
| Czechoslovakians | 99.4 /100 | #39 | Exceptional 10.9% |