Immigrants from Korea vs Immigrants from Indonesia No Schooling Completed
COMPARE
Immigrants from Korea
Immigrants from Indonesia
No Schooling Completed
No Schooling Completed Comparison
Immigrants from Korea
Immigrants from Indonesia
2.0%
NO SCHOOLING COMPLETED
66.7/ 100
METRIC RATING
158th/ 347
METRIC RANK
2.4%
NO SCHOOLING COMPLETED
1.5/ 100
METRIC RATING
242nd/ 347
METRIC RANK
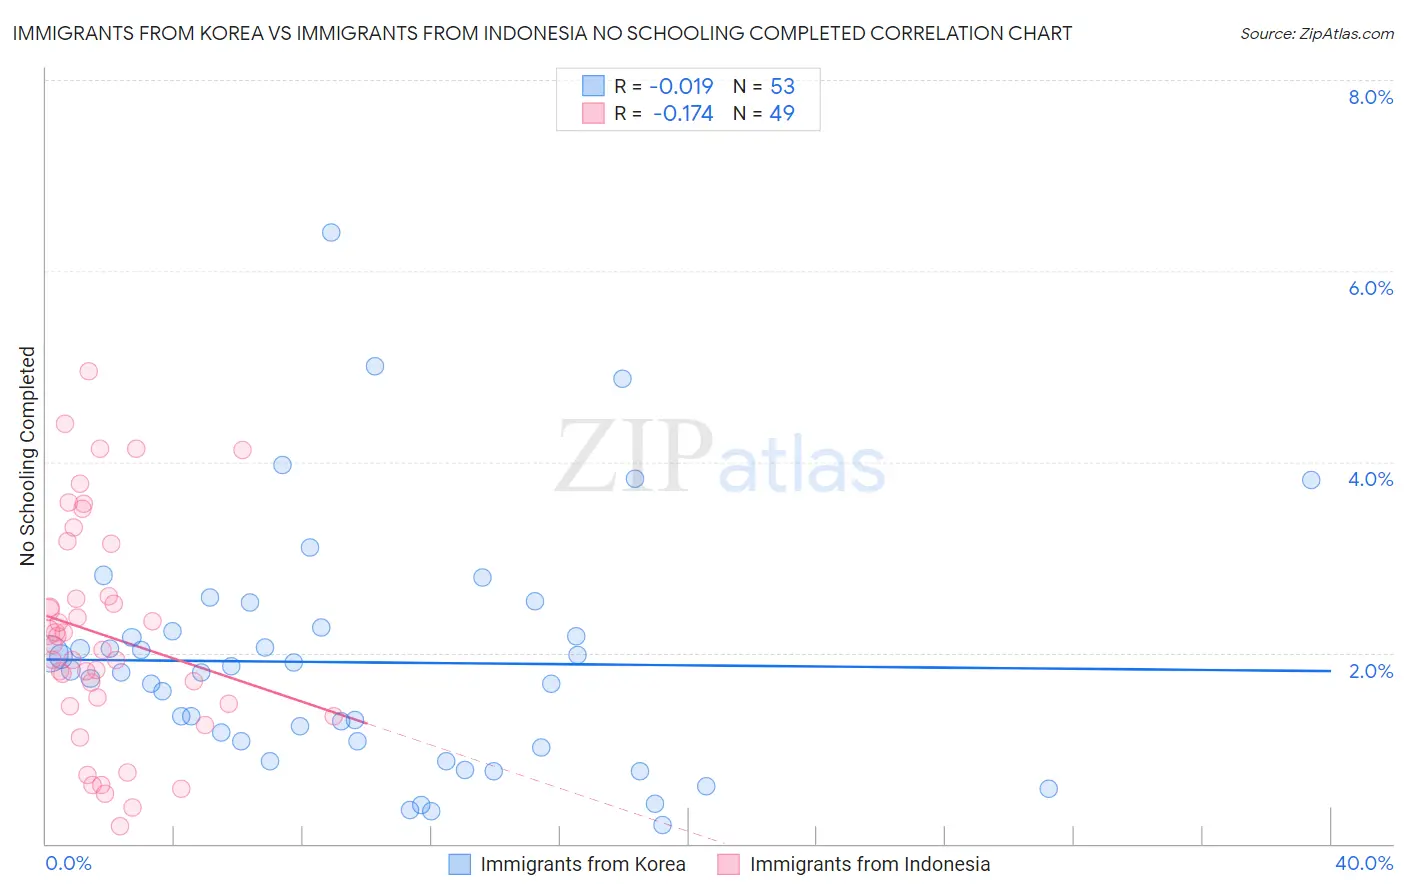
Immigrants from Korea vs Immigrants from Indonesia No Schooling Completed Correlation Chart
The statistical analysis conducted on geographies consisting of 411,278,726 people shows no correlation between the proportion of Immigrants from Korea and percentage of population with no schooling in the United States with a correlation coefficient (R) of -0.019 and weighted average of 2.0%. Similarly, the statistical analysis conducted on geographies consisting of 214,703,374 people shows a poor negative correlation between the proportion of Immigrants from Indonesia and percentage of population with no schooling in the United States with a correlation coefficient (R) of -0.174 and weighted average of 2.4%, a difference of 16.8%.
No Schooling Completed Correlation Summary
| Measurement | Immigrants from Korea | Immigrants from Indonesia |
| Minimum | 0.20% | 0.18% |
| Maximum | 6.4% | 4.9% |
| Range | 6.2% | 4.8% |
| Mean | 1.9% | 2.2% |
| Median | 1.8% | 2.1% |
| Interquartile 25% (IQ1) | 1.0% | 1.5% |
| Interquartile 75% (IQ3) | 2.2% | 2.9% |
| Interquartile Range (IQR) | 1.2% | 1.4% |
| Standard Deviation (Sample) | 1.3% | 1.1% |
| Standard Deviation (Population) | 1.2% | 1.1% |
Similar Demographics by No Schooling Completed
Demographics Similar to Immigrants from Korea by No Schooling Completed
In terms of no schooling completed, the demographic groups most similar to Immigrants from Korea are Immigrants from Sri Lanka (2.0%, a difference of 0.040%), Immigrants from Spain (2.0%, a difference of 0.050%), Chilean (2.0%, a difference of 0.080%), Immigrants from Russia (2.0%, a difference of 0.14%), and Kenyan (2.0%, a difference of 0.16%).
| Demographics | Rating | Rank | No Schooling Completed |
| Immigrants | Jordan | 70.9 /100 | #151 | Good 2.0% |
| Immigrants | Eastern Europe | 70.4 /100 | #152 | Good 2.0% |
| Immigrants | Italy | 68.9 /100 | #153 | Good 2.0% |
| Immigrants | Venezuela | 68.5 /100 | #154 | Good 2.0% |
| Immigrants | Russia | 67.6 /100 | #155 | Good 2.0% |
| Chileans | 67.2 /100 | #156 | Good 2.0% |
| Immigrants | Sri Lanka | 67.0 /100 | #157 | Good 2.0% |
| Immigrants | Korea | 66.7 /100 | #158 | Good 2.0% |
| Immigrants | Spain | 66.4 /100 | #159 | Good 2.0% |
| Kenyans | 65.7 /100 | #160 | Good 2.0% |
| Ugandans | 64.6 /100 | #161 | Good 2.0% |
| Immigrants | Brazil | 63.8 /100 | #162 | Good 2.1% |
| Albanians | 62.2 /100 | #163 | Good 2.1% |
| Comanche | 60.7 /100 | #164 | Good 2.1% |
| Brazilians | 60.2 /100 | #165 | Good 2.1% |
Demographics Similar to Immigrants from Indonesia by No Schooling Completed
In terms of no schooling completed, the demographic groups most similar to Immigrants from Indonesia are South American (2.4%, a difference of 0.040%), Peruvian (2.4%, a difference of 0.14%), Bolivian (2.4%, a difference of 0.15%), Immigrants from Congo (2.4%, a difference of 0.20%), and Immigrants from Iraq (2.4%, a difference of 0.30%).
| Demographics | Rating | Rank | No Schooling Completed |
| Immigrants | Western Asia | 2.6 /100 | #235 | Tragic 2.3% |
| Iraqis | 2.2 /100 | #236 | Tragic 2.4% |
| Immigrants | Eastern Asia | 2.0 /100 | #237 | Tragic 2.4% |
| Paiute | 1.9 /100 | #238 | Tragic 2.4% |
| Liberians | 1.8 /100 | #239 | Tragic 2.4% |
| Immigrants | Senegal | 1.7 /100 | #240 | Tragic 2.4% |
| Koreans | 1.7 /100 | #241 | Tragic 2.4% |
| Immigrants | Indonesia | 1.5 /100 | #242 | Tragic 2.4% |
| South Americans | 1.5 /100 | #243 | Tragic 2.4% |
| Peruvians | 1.4 /100 | #244 | Tragic 2.4% |
| Bolivians | 1.4 /100 | #245 | Tragic 2.4% |
| Immigrants | Congo | 1.4 /100 | #246 | Tragic 2.4% |
| Immigrants | Iraq | 1.3 /100 | #247 | Tragic 2.4% |
| Asians | 1.2 /100 | #248 | Tragic 2.4% |
| Jamaicans | 1.2 /100 | #249 | Tragic 2.4% |