Immigrants from Kenya vs Northern European College, 1 year or more
COMPARE
Immigrants from Kenya
Northern European
College, 1 year or more
College, 1 year or more Comparison
Immigrants from Kenya
Northern Europeans
60.5%
COLLEGE, 1 YEAR OR MORE
79.1/ 100
METRIC RATING
147th/ 347
METRIC RANK
62.9%
COLLEGE, 1 YEAR OR MORE
98.8/ 100
METRIC RATING
79th/ 347
METRIC RANK
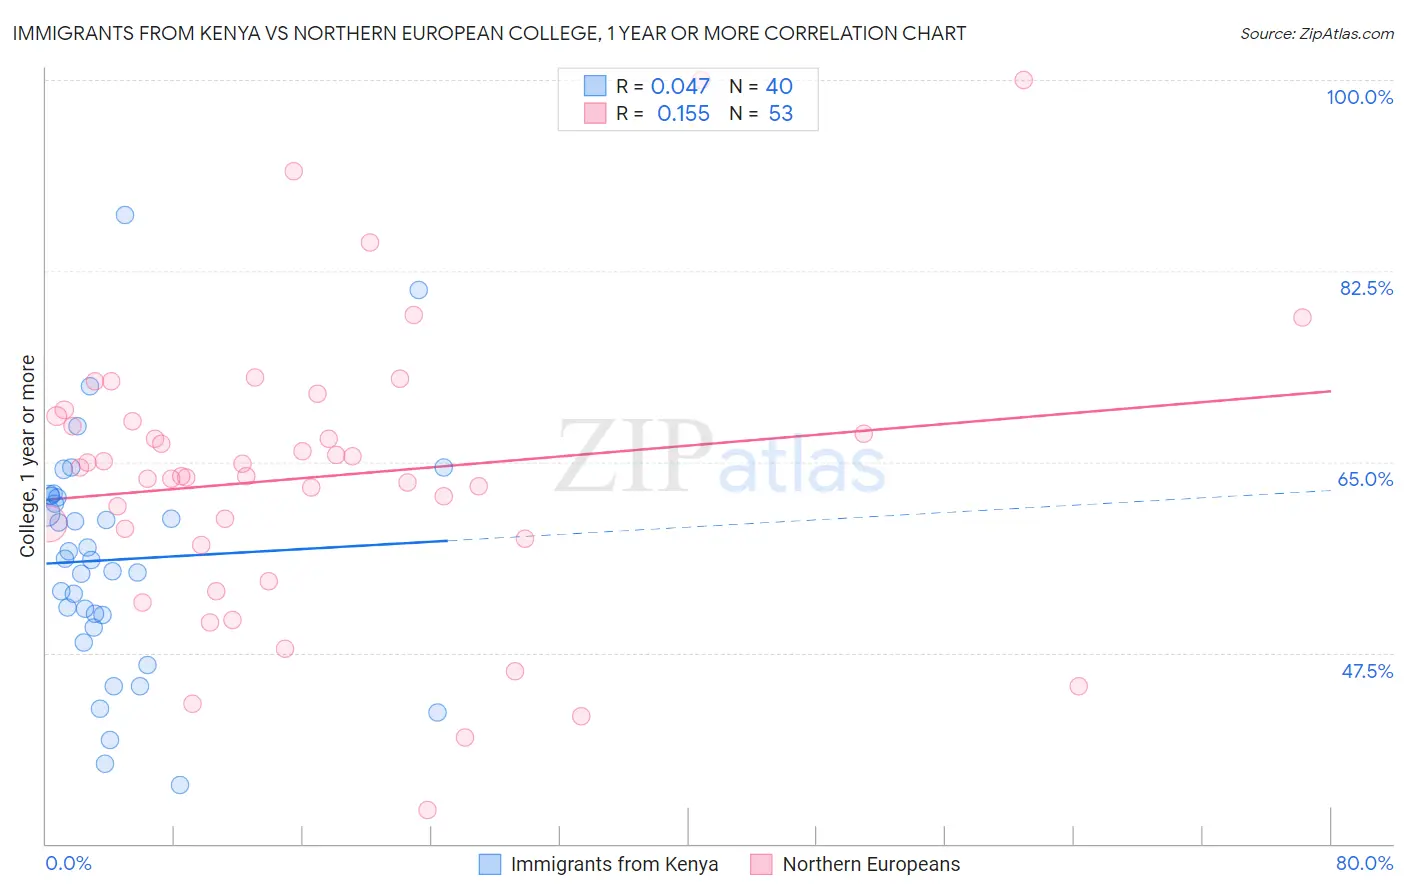
Immigrants from Kenya vs Northern European College, 1 year or more Correlation Chart
The statistical analysis conducted on geographies consisting of 218,085,582 people shows no correlation between the proportion of Immigrants from Kenya and percentage of population with at least college, 1 year or more education in the United States with a correlation coefficient (R) of 0.047 and weighted average of 60.5%. Similarly, the statistical analysis conducted on geographies consisting of 406,096,233 people shows a poor positive correlation between the proportion of Northern Europeans and percentage of population with at least college, 1 year or more education in the United States with a correlation coefficient (R) of 0.155 and weighted average of 62.9%, a difference of 4.0%.
College, 1 year or more Correlation Summary
| Measurement | Immigrants from Kenya | Northern European |
| Minimum | 35.4% | 33.1% |
| Maximum | 87.6% | 100.0% |
| Range | 52.2% | 66.9% |
| Mean | 56.0% | 63.7% |
| Median | 56.0% | 63.7% |
| Interquartile 25% (IQ1) | 50.4% | 57.7% |
| Interquartile 75% (IQ3) | 61.8% | 69.0% |
| Interquartile Range (IQR) | 11.4% | 11.3% |
| Standard Deviation (Sample) | 10.7% | 13.2% |
| Standard Deviation (Population) | 10.6% | 13.1% |
Similar Demographics by College, 1 year or more
Demographics Similar to Immigrants from Kenya by College, 1 year or more
In terms of college, 1 year or more, the demographic groups most similar to Immigrants from Kenya are Kenyan (60.5%, a difference of 0.010%), Brazilian (60.5%, a difference of 0.010%), Scottish (60.5%, a difference of 0.090%), Immigrants from Sudan (60.4%, a difference of 0.10%), and Albanian (60.4%, a difference of 0.10%).
| Demographics | Rating | Rank | College, 1 year or more |
| Iraqis | 83.3 /100 | #140 | Excellent 60.7% |
| Immigrants | Afghanistan | 83.1 /100 | #141 | Excellent 60.7% |
| Poles | 82.8 /100 | #142 | Excellent 60.7% |
| Canadians | 82.7 /100 | #143 | Excellent 60.6% |
| Czechs | 81.9 /100 | #144 | Excellent 60.6% |
| Slavs | 81.1 /100 | #145 | Excellent 60.6% |
| Scottish | 80.2 /100 | #146 | Excellent 60.5% |
| Immigrants | Kenya | 79.1 /100 | #147 | Good 60.5% |
| Kenyans | 79.0 /100 | #148 | Good 60.5% |
| Brazilians | 79.0 /100 | #149 | Good 60.5% |
| Immigrants | Sudan | 77.8 /100 | #150 | Good 60.4% |
| Albanians | 77.8 /100 | #151 | Good 60.4% |
| Immigrants | Germany | 76.1 /100 | #152 | Good 60.3% |
| Sierra Leoneans | 74.1 /100 | #153 | Good 60.2% |
| Sudanese | 73.0 /100 | #154 | Good 60.2% |
Demographics Similar to Northern Europeans by College, 1 year or more
In terms of college, 1 year or more, the demographic groups most similar to Northern Europeans are Immigrants from Lebanon (62.9%, a difference of 0.010%), Paraguayan (62.9%, a difference of 0.030%), Ethiopian (62.9%, a difference of 0.030%), Lithuanian (62.9%, a difference of 0.040%), and Laotian (62.8%, a difference of 0.090%).
| Demographics | Rating | Rank | College, 1 year or more |
| Egyptians | 99.0 /100 | #72 | Exceptional 63.1% |
| Immigrants | Moldova | 99.0 /100 | #73 | Exceptional 63.0% |
| Immigrants | North America | 99.0 /100 | #74 | Exceptional 63.0% |
| Armenians | 98.9 /100 | #75 | Exceptional 63.0% |
| Paraguayans | 98.8 /100 | #76 | Exceptional 62.9% |
| Ethiopians | 98.8 /100 | #77 | Exceptional 62.9% |
| Immigrants | Lebanon | 98.8 /100 | #78 | Exceptional 62.9% |
| Northern Europeans | 98.8 /100 | #79 | Exceptional 62.9% |
| Lithuanians | 98.8 /100 | #80 | Exceptional 62.9% |
| Laotians | 98.7 /100 | #81 | Exceptional 62.8% |
| Immigrants | Bolivia | 98.7 /100 | #82 | Exceptional 62.8% |
| Immigrants | Argentina | 98.6 /100 | #83 | Exceptional 62.8% |
| Immigrants | England | 98.6 /100 | #84 | Exceptional 62.8% |
| Immigrants | Pakistan | 98.6 /100 | #85 | Exceptional 62.8% |
| Immigrants | Western Europe | 98.6 /100 | #86 | Exceptional 62.7% |