Immigrants from Kenya vs Immigrants from El Salvador College, 1 year or more
COMPARE
Immigrants from Kenya
Immigrants from El Salvador
College, 1 year or more
College, 1 year or more Comparison
Immigrants from Kenya
Immigrants from El Salvador
60.5%
COLLEGE, 1 YEAR OR MORE
79.1/ 100
METRIC RATING
147th/ 347
METRIC RANK
51.0%
COLLEGE, 1 YEAR OR MORE
0.0/ 100
METRIC RATING
319th/ 347
METRIC RANK
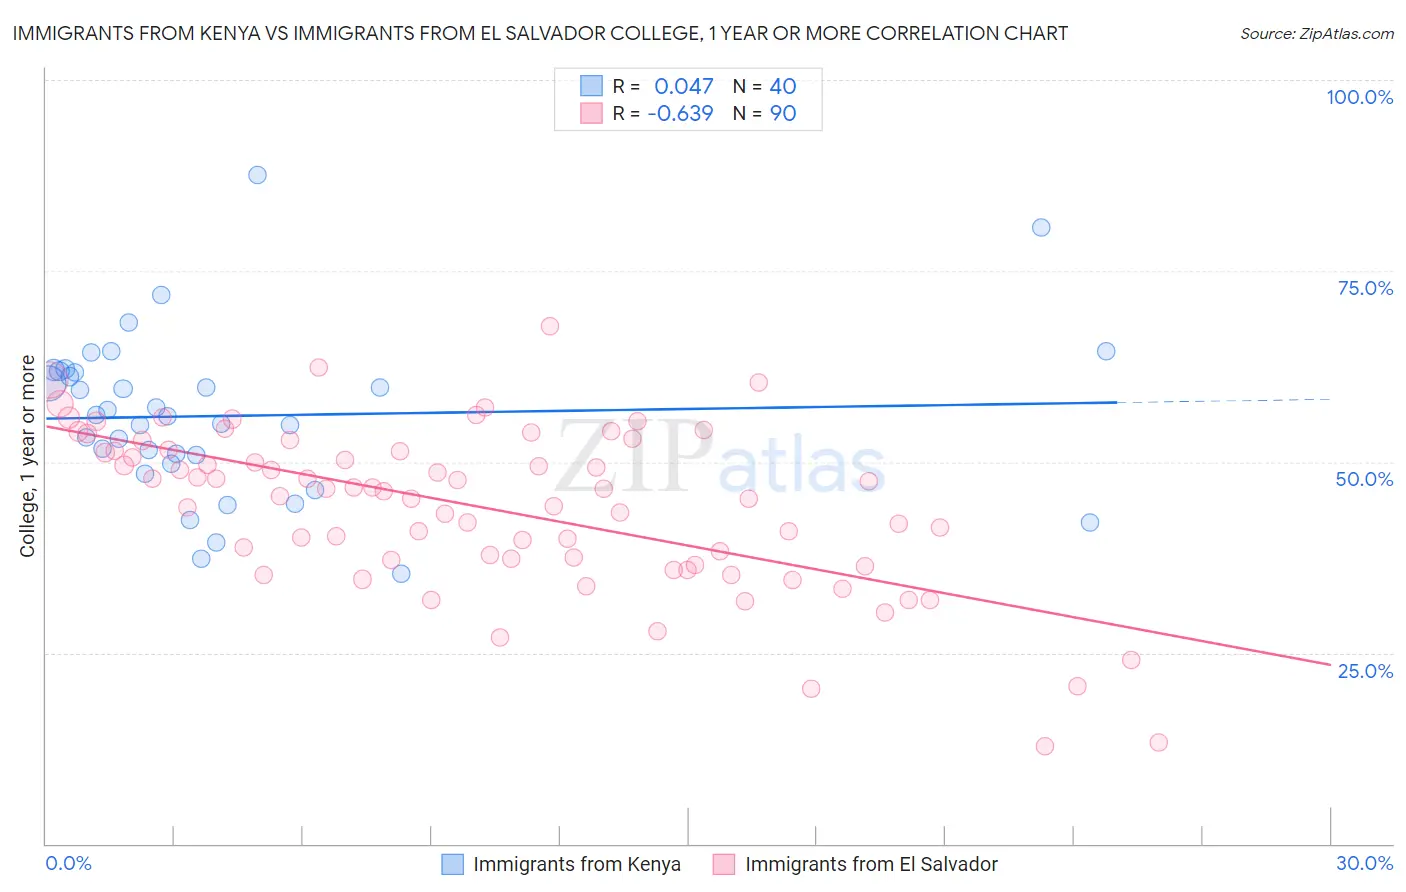
Immigrants from Kenya vs Immigrants from El Salvador College, 1 year or more Correlation Chart
The statistical analysis conducted on geographies consisting of 218,085,582 people shows no correlation between the proportion of Immigrants from Kenya and percentage of population with at least college, 1 year or more education in the United States with a correlation coefficient (R) of 0.047 and weighted average of 60.5%. Similarly, the statistical analysis conducted on geographies consisting of 357,850,135 people shows a significant negative correlation between the proportion of Immigrants from El Salvador and percentage of population with at least college, 1 year or more education in the United States with a correlation coefficient (R) of -0.639 and weighted average of 51.0%, a difference of 18.5%.
College, 1 year or more Correlation Summary
| Measurement | Immigrants from Kenya | Immigrants from El Salvador |
| Minimum | 35.4% | 12.7% |
| Maximum | 87.6% | 67.7% |
| Range | 52.2% | 55.1% |
| Mean | 56.0% | 44.0% |
| Median | 56.0% | 46.3% |
| Interquartile 25% (IQ1) | 50.4% | 37.2% |
| Interquartile 75% (IQ3) | 61.8% | 51.5% |
| Interquartile Range (IQR) | 11.4% | 14.3% |
| Standard Deviation (Sample) | 10.7% | 10.6% |
| Standard Deviation (Population) | 10.6% | 10.5% |
Similar Demographics by College, 1 year or more
Demographics Similar to Immigrants from Kenya by College, 1 year or more
In terms of college, 1 year or more, the demographic groups most similar to Immigrants from Kenya are Kenyan (60.5%, a difference of 0.010%), Brazilian (60.5%, a difference of 0.010%), Scottish (60.5%, a difference of 0.090%), Immigrants from Sudan (60.4%, a difference of 0.10%), and Albanian (60.4%, a difference of 0.10%).
| Demographics | Rating | Rank | College, 1 year or more |
| Iraqis | 83.3 /100 | #140 | Excellent 60.7% |
| Immigrants | Afghanistan | 83.1 /100 | #141 | Excellent 60.7% |
| Poles | 82.8 /100 | #142 | Excellent 60.7% |
| Canadians | 82.7 /100 | #143 | Excellent 60.6% |
| Czechs | 81.9 /100 | #144 | Excellent 60.6% |
| Slavs | 81.1 /100 | #145 | Excellent 60.6% |
| Scottish | 80.2 /100 | #146 | Excellent 60.5% |
| Immigrants | Kenya | 79.1 /100 | #147 | Good 60.5% |
| Kenyans | 79.0 /100 | #148 | Good 60.5% |
| Brazilians | 79.0 /100 | #149 | Good 60.5% |
| Immigrants | Sudan | 77.8 /100 | #150 | Good 60.4% |
| Albanians | 77.8 /100 | #151 | Good 60.4% |
| Immigrants | Germany | 76.1 /100 | #152 | Good 60.3% |
| Sierra Leoneans | 74.1 /100 | #153 | Good 60.2% |
| Sudanese | 73.0 /100 | #154 | Good 60.2% |
Demographics Similar to Immigrants from El Salvador by College, 1 year or more
In terms of college, 1 year or more, the demographic groups most similar to Immigrants from El Salvador are Kiowa (51.0%, a difference of 0.060%), Immigrants from Honduras (51.0%, a difference of 0.090%), Hopi (50.9%, a difference of 0.19%), Hispanic or Latino (51.1%, a difference of 0.22%), and Cajun (51.2%, a difference of 0.31%).
| Demographics | Rating | Rank | College, 1 year or more |
| Pueblo | 0.0 /100 | #312 | Tragic 51.5% |
| Immigrants | Caribbean | 0.0 /100 | #313 | Tragic 51.4% |
| Fijians | 0.0 /100 | #314 | Tragic 51.3% |
| Guatemalans | 0.0 /100 | #315 | Tragic 51.2% |
| Cajuns | 0.0 /100 | #316 | Tragic 51.2% |
| Hispanics or Latinos | 0.0 /100 | #317 | Tragic 51.1% |
| Immigrants | Honduras | 0.0 /100 | #318 | Tragic 51.0% |
| Immigrants | El Salvador | 0.0 /100 | #319 | Tragic 51.0% |
| Kiowa | 0.0 /100 | #320 | Tragic 51.0% |
| Hopi | 0.0 /100 | #321 | Tragic 50.9% |
| Navajo | 0.0 /100 | #322 | Tragic 50.8% |
| Immigrants | Guatemala | 0.0 /100 | #323 | Tragic 50.7% |
| Immigrants | Cuba | 0.0 /100 | #324 | Tragic 50.7% |
| Immigrants | Latin America | 0.0 /100 | #325 | Tragic 50.7% |
| Dominicans | 0.0 /100 | #326 | Tragic 50.6% |