Immigrants from Hungary vs Hmong College, 1 year or more
COMPARE
Immigrants from Hungary
Hmong
College, 1 year or more
College, 1 year or more Comparison
Immigrants from Hungary
Hmong
62.7%
COLLEGE, 1 YEAR OR MORE
98.6/ 100
METRIC RATING
87th/ 347
METRIC RANK
57.2%
COLLEGE, 1 YEAR OR MORE
5.4/ 100
METRIC RATING
224th/ 347
METRIC RANK
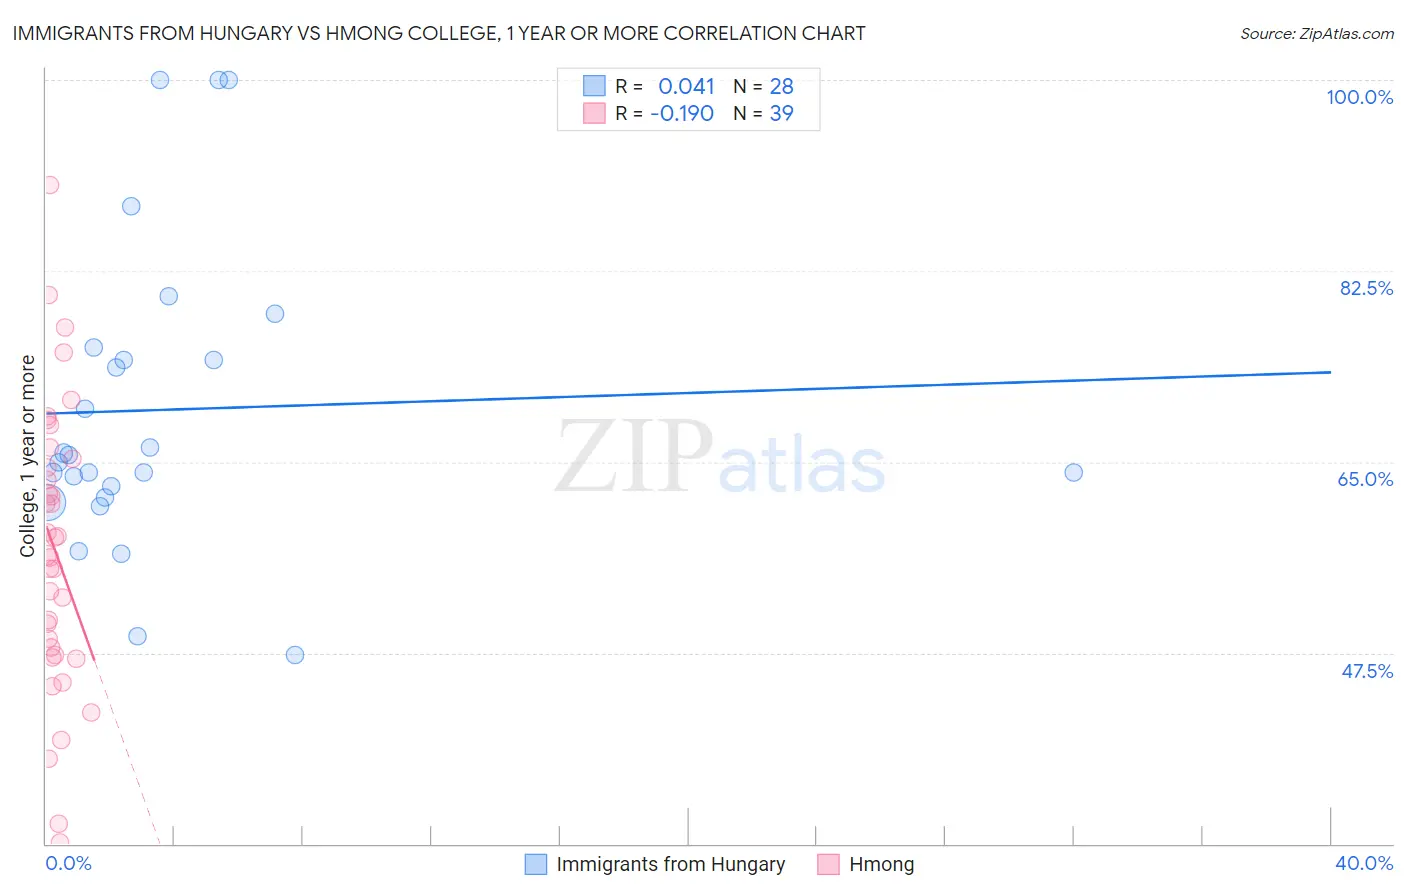
Immigrants from Hungary vs Hmong College, 1 year or more Correlation Chart
The statistical analysis conducted on geographies consisting of 195,707,305 people shows no correlation between the proportion of Immigrants from Hungary and percentage of population with at least college, 1 year or more education in the United States with a correlation coefficient (R) of 0.041 and weighted average of 62.7%. Similarly, the statistical analysis conducted on geographies consisting of 24,680,511 people shows a poor negative correlation between the proportion of Hmong and percentage of population with at least college, 1 year or more education in the United States with a correlation coefficient (R) of -0.190 and weighted average of 57.2%, a difference of 9.8%.
College, 1 year or more Correlation Summary
| Measurement | Immigrants from Hungary | Hmong |
| Minimum | 47.4% | 30.1% |
| Maximum | 100.0% | 90.4% |
| Range | 52.6% | 60.4% |
| Mean | 69.8% | 56.9% |
| Median | 65.3% | 56.5% |
| Interquartile 25% (IQ1) | 62.2% | 47.3% |
| Interquartile 75% (IQ3) | 74.9% | 65.3% |
| Interquartile Range (IQR) | 12.7% | 18.0% |
| Standard Deviation (Sample) | 13.8% | 13.1% |
| Standard Deviation (Population) | 13.5% | 12.9% |
Similar Demographics by College, 1 year or more
Demographics Similar to Immigrants from Hungary by College, 1 year or more
In terms of college, 1 year or more, the demographic groups most similar to Immigrants from Hungary are Immigrants from Western Europe (62.7%, a difference of 0.020%), Immigrants from England (62.8%, a difference of 0.040%), Immigrants from Pakistan (62.8%, a difference of 0.040%), Immigrants from Argentina (62.8%, a difference of 0.080%), and Immigrants from Bolivia (62.8%, a difference of 0.11%).
| Demographics | Rating | Rank | College, 1 year or more |
| Lithuanians | 98.8 /100 | #80 | Exceptional 62.9% |
| Laotians | 98.7 /100 | #81 | Exceptional 62.8% |
| Immigrants | Bolivia | 98.7 /100 | #82 | Exceptional 62.8% |
| Immigrants | Argentina | 98.6 /100 | #83 | Exceptional 62.8% |
| Immigrants | England | 98.6 /100 | #84 | Exceptional 62.8% |
| Immigrants | Pakistan | 98.6 /100 | #85 | Exceptional 62.8% |
| Immigrants | Western Europe | 98.6 /100 | #86 | Exceptional 62.7% |
| Immigrants | Hungary | 98.6 /100 | #87 | Exceptional 62.7% |
| Greeks | 98.3 /100 | #88 | Exceptional 62.6% |
| Immigrants | Ethiopia | 98.2 /100 | #89 | Exceptional 62.6% |
| Immigrants | Western Asia | 97.9 /100 | #90 | Exceptional 62.5% |
| Immigrants | Eastern Europe | 97.8 /100 | #91 | Exceptional 62.4% |
| Immigrants | Egypt | 97.8 /100 | #92 | Exceptional 62.4% |
| Romanians | 97.7 /100 | #93 | Exceptional 62.4% |
| Immigrants | Croatia | 97.6 /100 | #94 | Exceptional 62.3% |
Demographics Similar to Hmong by College, 1 year or more
In terms of college, 1 year or more, the demographic groups most similar to Hmong are Portuguese (57.2%, a difference of 0.0%), Subsaharan African (57.3%, a difference of 0.17%), Vietnamese (57.0%, a difference of 0.21%), Immigrants from Western Africa (57.0%, a difference of 0.23%), and Immigrants (57.0%, a difference of 0.30%).
| Demographics | Rating | Rank | College, 1 year or more |
| Immigrants | Panama | 9.1 /100 | #217 | Tragic 57.6% |
| Native Hawaiians | 9.0 /100 | #218 | Tragic 57.6% |
| Whites/Caucasians | 8.7 /100 | #219 | Tragic 57.6% |
| Immigrants | Costa Rica | 8.0 /100 | #220 | Tragic 57.5% |
| Immigrants | Ghana | 7.7 /100 | #221 | Tragic 57.4% |
| Sub-Saharan Africans | 6.1 /100 | #222 | Tragic 57.3% |
| Portuguese | 5.4 /100 | #223 | Tragic 57.2% |
| Hmong | 5.4 /100 | #224 | Tragic 57.2% |
| Vietnamese | 4.7 /100 | #225 | Tragic 57.0% |
| Immigrants | Western Africa | 4.6 /100 | #226 | Tragic 57.0% |
| Immigrants | Immigrants | 4.4 /100 | #227 | Tragic 57.0% |
| Immigrants | Fiji | 4.0 /100 | #228 | Tragic 56.9% |
| Cree | 3.6 /100 | #229 | Tragic 56.8% |
| Liberians | 3.1 /100 | #230 | Tragic 56.7% |
| Immigrants | Burma/Myanmar | 2.7 /100 | #231 | Tragic 56.6% |