Immigrants from Hungary vs Immigrants from Nepal College, 1 year or more
COMPARE
Immigrants from Hungary
Immigrants from Nepal
College, 1 year or more
College, 1 year or more Comparison
Immigrants from Hungary
Immigrants from Nepal
62.7%
COLLEGE, 1 YEAR OR MORE
98.6/ 100
METRIC RATING
87th/ 347
METRIC RANK
62.0%
COLLEGE, 1 YEAR OR MORE
96.3/ 100
METRIC RATING
105th/ 347
METRIC RANK
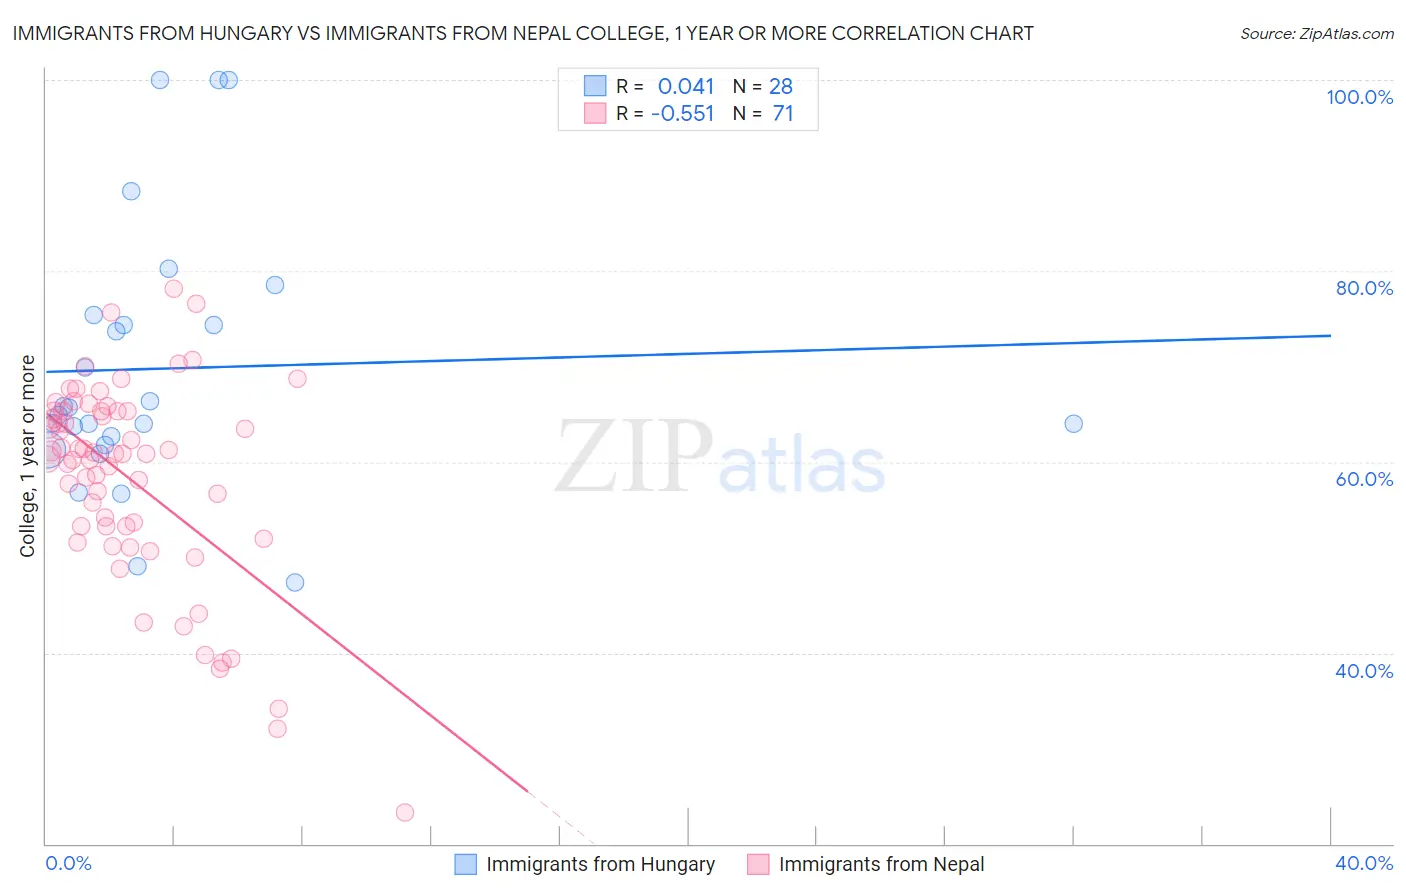
Immigrants from Hungary vs Immigrants from Nepal College, 1 year or more Correlation Chart
The statistical analysis conducted on geographies consisting of 195,707,305 people shows no correlation between the proportion of Immigrants from Hungary and percentage of population with at least college, 1 year or more education in the United States with a correlation coefficient (R) of 0.041 and weighted average of 62.7%. Similarly, the statistical analysis conducted on geographies consisting of 186,770,697 people shows a substantial negative correlation between the proportion of Immigrants from Nepal and percentage of population with at least college, 1 year or more education in the United States with a correlation coefficient (R) of -0.551 and weighted average of 62.0%, a difference of 1.2%.
College, 1 year or more Correlation Summary
| Measurement | Immigrants from Hungary | Immigrants from Nepal |
| Minimum | 47.4% | 23.3% |
| Maximum | 100.0% | 78.1% |
| Range | 52.6% | 54.8% |
| Mean | 69.8% | 58.2% |
| Median | 65.3% | 60.8% |
| Interquartile 25% (IQ1) | 62.2% | 53.2% |
| Interquartile 75% (IQ3) | 74.9% | 65.3% |
| Interquartile Range (IQR) | 12.7% | 12.1% |
| Standard Deviation (Sample) | 13.8% | 10.6% |
| Standard Deviation (Population) | 13.5% | 10.6% |
Demographics Similar to Immigrants from Hungary and Immigrants from Nepal by College, 1 year or more
In terms of college, 1 year or more, the demographic groups most similar to Immigrants from Hungary are Immigrants from Western Europe (62.7%, a difference of 0.020%), Greek (62.6%, a difference of 0.17%), Immigrants from Ethiopia (62.6%, a difference of 0.27%), Immigrants from Western Asia (62.5%, a difference of 0.45%), and Immigrants from Eastern Europe (62.4%, a difference of 0.55%). Similarly, the demographic groups most similar to Immigrants from Nepal are Palestinian (62.0%, a difference of 0.0%), Chilean (62.0%, a difference of 0.020%), Afghan (62.0%, a difference of 0.030%), Luxembourger (62.1%, a difference of 0.15%), and Swedish (62.1%, a difference of 0.16%).
| Demographics | Rating | Rank | College, 1 year or more |
| Immigrants | Western Europe | 98.6 /100 | #86 | Exceptional 62.7% |
| Immigrants | Hungary | 98.6 /100 | #87 | Exceptional 62.7% |
| Greeks | 98.3 /100 | #88 | Exceptional 62.6% |
| Immigrants | Ethiopia | 98.2 /100 | #89 | Exceptional 62.6% |
| Immigrants | Western Asia | 97.9 /100 | #90 | Exceptional 62.5% |
| Immigrants | Eastern Europe | 97.8 /100 | #91 | Exceptional 62.4% |
| Immigrants | Egypt | 97.8 /100 | #92 | Exceptional 62.4% |
| Romanians | 97.7 /100 | #93 | Exceptional 62.4% |
| Immigrants | Croatia | 97.6 /100 | #94 | Exceptional 62.3% |
| British | 97.4 /100 | #95 | Exceptional 62.3% |
| Chinese | 97.2 /100 | #96 | Exceptional 62.2% |
| Jordanians | 97.2 /100 | #97 | Exceptional 62.2% |
| Carpatho Rusyns | 97.2 /100 | #98 | Exceptional 62.2% |
| Croatians | 97.1 /100 | #99 | Exceptional 62.2% |
| Icelanders | 96.8 /100 | #100 | Exceptional 62.1% |
| Swedes | 96.8 /100 | #101 | Exceptional 62.1% |
| Luxembourgers | 96.7 /100 | #102 | Exceptional 62.1% |
| Afghans | 96.4 /100 | #103 | Exceptional 62.0% |
| Chileans | 96.4 /100 | #104 | Exceptional 62.0% |
| Immigrants | Nepal | 96.3 /100 | #105 | Exceptional 62.0% |
| Palestinians | 96.3 /100 | #106 | Exceptional 62.0% |