Immigrants from Grenada vs Cherokee Bachelor's Degree
COMPARE
Immigrants from Grenada
Cherokee
Bachelor's Degree
Bachelor's Degree Comparison
Immigrants from Grenada
Cherokee
35.0%
BACHELOR'S DEGREE
4.3/ 100
METRIC RATING
230th/ 347
METRIC RANK
30.2%
BACHELOR'S DEGREE
0.0/ 100
METRIC RATING
304th/ 347
METRIC RANK
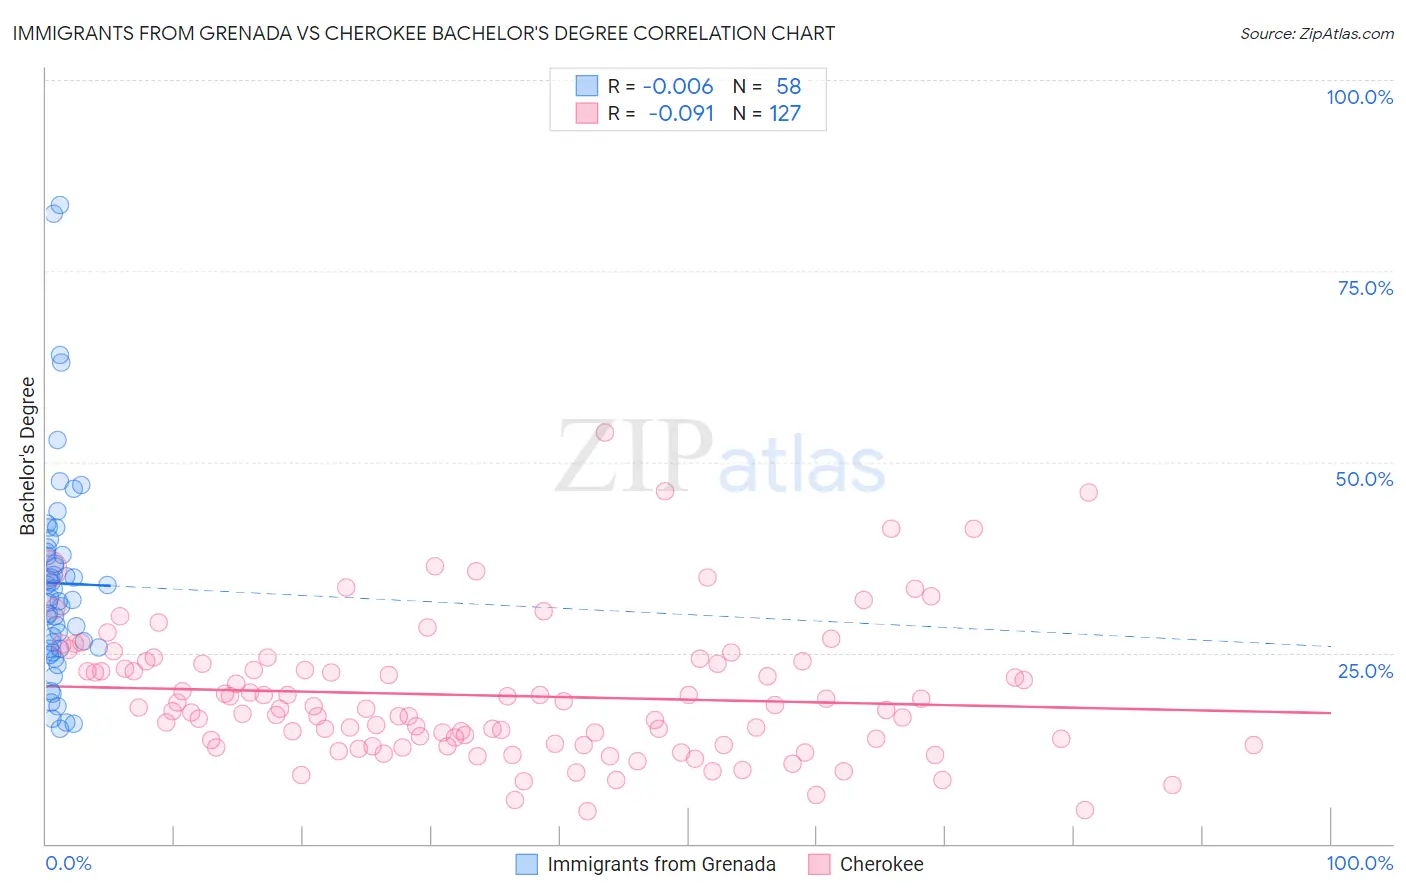
Immigrants from Grenada vs Cherokee Bachelor's Degree Correlation Chart
The statistical analysis conducted on geographies consisting of 67,201,096 people shows no correlation between the proportion of Immigrants from Grenada and percentage of population with at least bachelor's degree education in the United States with a correlation coefficient (R) of -0.006 and weighted average of 35.0%. Similarly, the statistical analysis conducted on geographies consisting of 493,657,197 people shows a slight negative correlation between the proportion of Cherokee and percentage of population with at least bachelor's degree education in the United States with a correlation coefficient (R) of -0.091 and weighted average of 30.2%, a difference of 15.9%.
Bachelor's Degree Correlation Summary
| Measurement | Immigrants from Grenada | Cherokee |
| Minimum | 15.1% | 4.3% |
| Maximum | 83.6% | 53.8% |
| Range | 68.5% | 49.6% |
| Mean | 34.1% | 19.4% |
| Median | 32.1% | 17.6% |
| Interquartile 25% (IQ1) | 25.5% | 13.0% |
| Interquartile 75% (IQ3) | 38.2% | 23.6% |
| Interquartile Range (IQR) | 12.7% | 10.6% |
| Standard Deviation (Sample) | 14.0% | 8.9% |
| Standard Deviation (Population) | 13.8% | 8.8% |
Similar Demographics by Bachelor's Degree
Demographics Similar to Immigrants from Grenada by Bachelor's Degree
In terms of bachelor's degree, the demographic groups most similar to Immigrants from Grenada are Immigrants from St. Vincent and the Grenadines (35.0%, a difference of 0.020%), Hmong (34.8%, a difference of 0.65%), Immigrants from Ecuador (34.7%, a difference of 0.76%), White/Caucasian (35.3%, a difference of 0.84%), and Immigrants from Trinidad and Tobago (35.3%, a difference of 0.93%).
| Demographics | Rating | Rank | Bachelor's Degree |
| French Canadians | 8.3 /100 | #223 | Tragic 35.6% |
| Immigrants | Barbados | 7.5 /100 | #224 | Tragic 35.5% |
| Immigrants | Burma/Myanmar | 7.3 /100 | #225 | Tragic 35.5% |
| Portuguese | 7.2 /100 | #226 | Tragic 35.5% |
| Ecuadorians | 6.6 /100 | #227 | Tragic 35.4% |
| Immigrants | Trinidad and Tobago | 6.0 /100 | #228 | Tragic 35.3% |
| Whites/Caucasians | 5.9 /100 | #229 | Tragic 35.3% |
| Immigrants | Grenada | 4.3 /100 | #230 | Tragic 35.0% |
| Immigrants | St. Vincent and the Grenadines | 4.3 /100 | #231 | Tragic 35.0% |
| Hmong | 3.4 /100 | #232 | Tragic 34.8% |
| Immigrants | Ecuador | 3.3 /100 | #233 | Tragic 34.7% |
| Guamanians/Chamorros | 3.0 /100 | #234 | Tragic 34.6% |
| Immigrants | West Indies | 2.9 /100 | #235 | Tragic 34.6% |
| Liberians | 2.8 /100 | #236 | Tragic 34.6% |
| Tlingit-Haida | 2.8 /100 | #237 | Tragic 34.6% |
Demographics Similar to Cherokee by Bachelor's Degree
In terms of bachelor's degree, the demographic groups most similar to Cherokee are Bangladeshi (30.2%, a difference of 0.010%), Mexican American Indian (30.2%, a difference of 0.17%), Immigrants from Latin America (30.1%, a difference of 0.42%), Immigrants from Cuba (30.3%, a difference of 0.45%), and Immigrants from Micronesia (30.4%, a difference of 0.67%).
| Demographics | Rating | Rank | Bachelor's Degree |
| Immigrants | Haiti | 0.0 /100 | #297 | Tragic 30.6% |
| Chippewa | 0.0 /100 | #298 | Tragic 30.6% |
| Chickasaw | 0.0 /100 | #299 | Tragic 30.4% |
| Immigrants | Micronesia | 0.0 /100 | #300 | Tragic 30.4% |
| Immigrants | Cuba | 0.0 /100 | #301 | Tragic 30.3% |
| Mexican American Indians | 0.0 /100 | #302 | Tragic 30.2% |
| Bangladeshis | 0.0 /100 | #303 | Tragic 30.2% |
| Cherokee | 0.0 /100 | #304 | Tragic 30.2% |
| Immigrants | Latin America | 0.0 /100 | #305 | Tragic 30.1% |
| Immigrants | Yemen | 0.0 /100 | #306 | Tragic 29.9% |
| Nepalese | 0.0 /100 | #307 | Tragic 29.9% |
| Cajuns | 0.0 /100 | #308 | Tragic 29.6% |
| Hispanics or Latinos | 0.0 /100 | #309 | Tragic 29.6% |
| Cheyenne | 0.0 /100 | #310 | Tragic 29.4% |
| Choctaw | 0.0 /100 | #311 | Tragic 29.4% |