Immigrants from Grenada vs Immigrants from Brazil Bachelor's Degree
COMPARE
Immigrants from Grenada
Immigrants from Brazil
Bachelor's Degree
Bachelor's Degree Comparison
Immigrants from Grenada
Immigrants from Brazil
35.0%
BACHELOR'S DEGREE
4.3/ 100
METRIC RATING
230th/ 347
METRIC RANK
42.2%
BACHELOR'S DEGREE
99.2/ 100
METRIC RATING
86th/ 347
METRIC RANK
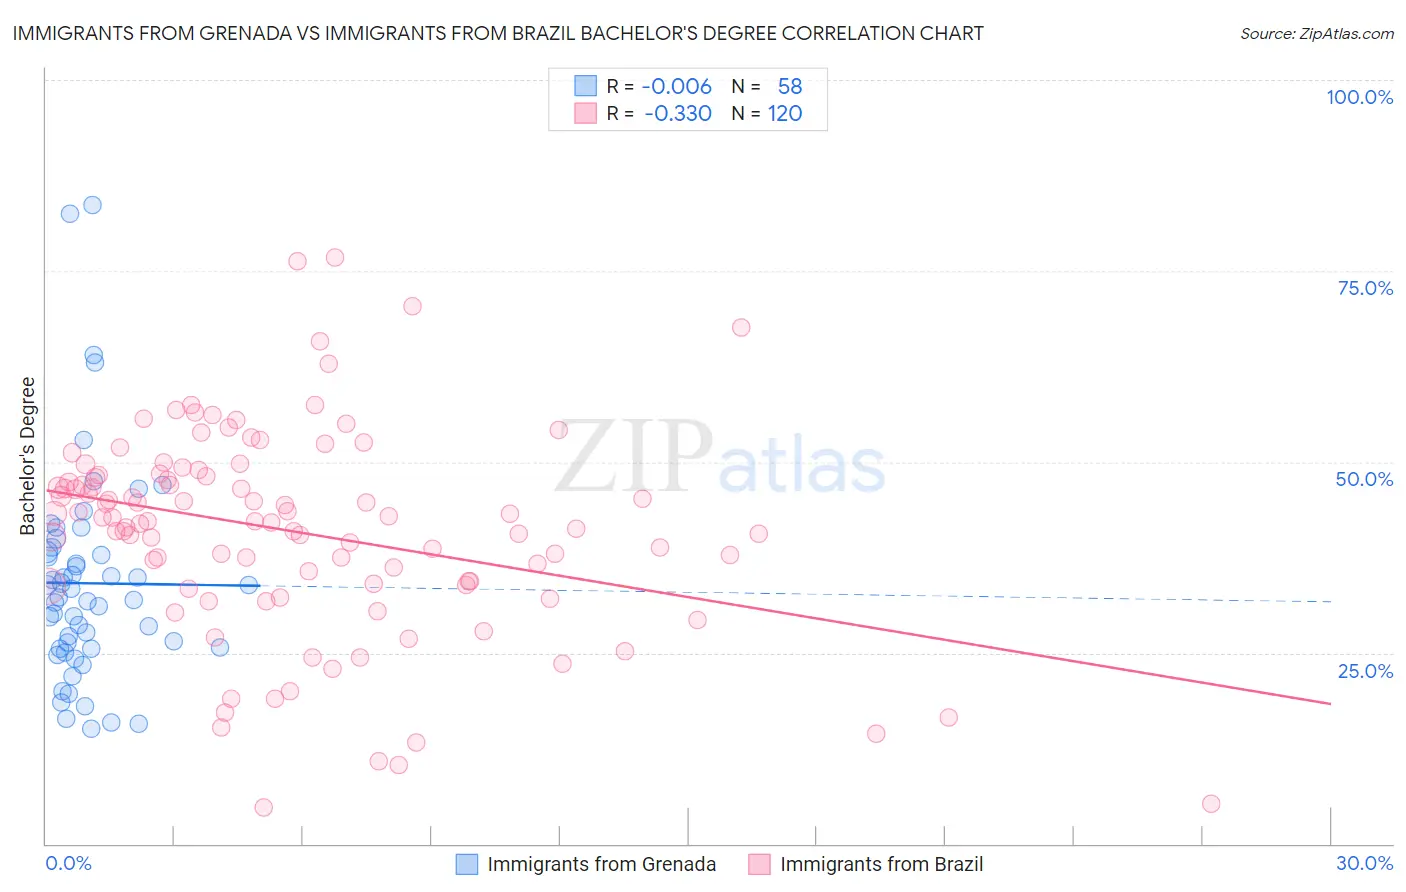
Immigrants from Grenada vs Immigrants from Brazil Bachelor's Degree Correlation Chart
The statistical analysis conducted on geographies consisting of 67,201,096 people shows no correlation between the proportion of Immigrants from Grenada and percentage of population with at least bachelor's degree education in the United States with a correlation coefficient (R) of -0.006 and weighted average of 35.0%. Similarly, the statistical analysis conducted on geographies consisting of 342,997,196 people shows a mild negative correlation between the proportion of Immigrants from Brazil and percentage of population with at least bachelor's degree education in the United States with a correlation coefficient (R) of -0.330 and weighted average of 42.2%, a difference of 20.7%.
Bachelor's Degree Correlation Summary
| Measurement | Immigrants from Grenada | Immigrants from Brazil |
| Minimum | 15.1% | 4.8% |
| Maximum | 83.6% | 76.8% |
| Range | 68.5% | 72.0% |
| Mean | 34.1% | 40.8% |
| Median | 32.1% | 42.2% |
| Interquartile 25% (IQ1) | 25.5% | 33.9% |
| Interquartile 75% (IQ3) | 38.2% | 48.3% |
| Interquartile Range (IQR) | 12.7% | 14.3% |
| Standard Deviation (Sample) | 14.0% | 13.5% |
| Standard Deviation (Population) | 13.8% | 13.5% |
Similar Demographics by Bachelor's Degree
Demographics Similar to Immigrants from Grenada by Bachelor's Degree
In terms of bachelor's degree, the demographic groups most similar to Immigrants from Grenada are Immigrants from St. Vincent and the Grenadines (35.0%, a difference of 0.020%), Hmong (34.8%, a difference of 0.65%), Immigrants from Ecuador (34.7%, a difference of 0.76%), White/Caucasian (35.3%, a difference of 0.84%), and Immigrants from Trinidad and Tobago (35.3%, a difference of 0.93%).
| Demographics | Rating | Rank | Bachelor's Degree |
| French Canadians | 8.3 /100 | #223 | Tragic 35.6% |
| Immigrants | Barbados | 7.5 /100 | #224 | Tragic 35.5% |
| Immigrants | Burma/Myanmar | 7.3 /100 | #225 | Tragic 35.5% |
| Portuguese | 7.2 /100 | #226 | Tragic 35.5% |
| Ecuadorians | 6.6 /100 | #227 | Tragic 35.4% |
| Immigrants | Trinidad and Tobago | 6.0 /100 | #228 | Tragic 35.3% |
| Whites/Caucasians | 5.9 /100 | #229 | Tragic 35.3% |
| Immigrants | Grenada | 4.3 /100 | #230 | Tragic 35.0% |
| Immigrants | St. Vincent and the Grenadines | 4.3 /100 | #231 | Tragic 35.0% |
| Hmong | 3.4 /100 | #232 | Tragic 34.8% |
| Immigrants | Ecuador | 3.3 /100 | #233 | Tragic 34.7% |
| Guamanians/Chamorros | 3.0 /100 | #234 | Tragic 34.6% |
| Immigrants | West Indies | 2.9 /100 | #235 | Tragic 34.6% |
| Liberians | 2.8 /100 | #236 | Tragic 34.6% |
| Tlingit-Haida | 2.8 /100 | #237 | Tragic 34.6% |
Demographics Similar to Immigrants from Brazil by Bachelor's Degree
In terms of bachelor's degree, the demographic groups most similar to Immigrants from Brazil are Lithuanian (42.2%, a difference of 0.080%), Immigrants from Western Asia (42.3%, a difference of 0.11%), Armenian (42.3%, a difference of 0.12%), Immigrants from Scotland (42.3%, a difference of 0.15%), and Immigrants from Hungary (42.3%, a difference of 0.22%).
| Demographics | Rating | Rank | Bachelor's Degree |
| Immigrants | Lebanon | 99.3 /100 | #79 | Exceptional 42.4% |
| Immigrants | Croatia | 99.2 /100 | #80 | Exceptional 42.3% |
| Immigrants | Hungary | 99.2 /100 | #81 | Exceptional 42.3% |
| Immigrants | Scotland | 99.2 /100 | #82 | Exceptional 42.3% |
| Armenians | 99.2 /100 | #83 | Exceptional 42.3% |
| Immigrants | Western Asia | 99.2 /100 | #84 | Exceptional 42.3% |
| Lithuanians | 99.2 /100 | #85 | Exceptional 42.2% |
| Immigrants | Brazil | 99.2 /100 | #86 | Exceptional 42.2% |
| Carpatho Rusyns | 99.0 /100 | #87 | Exceptional 42.1% |
| Immigrants | Western Europe | 99.0 /100 | #88 | Exceptional 42.0% |
| Greeks | 99.0 /100 | #89 | Exceptional 42.0% |
| Laotians | 98.9 /100 | #90 | Exceptional 42.0% |
| Immigrants | Northern Africa | 98.9 /100 | #91 | Exceptional 41.9% |
| Maltese | 98.8 /100 | #92 | Exceptional 41.9% |
| Immigrants | Canada | 98.6 /100 | #93 | Exceptional 41.7% |