Aleut vs Cherokee Bachelor's Degree
COMPARE
Aleut
Cherokee
Bachelor's Degree
Bachelor's Degree Comparison
Aleuts
Cherokee
31.3%
BACHELOR'S DEGREE
0.1/ 100
METRIC RATING
285th/ 347
METRIC RANK
30.2%
BACHELOR'S DEGREE
0.0/ 100
METRIC RATING
304th/ 347
METRIC RANK
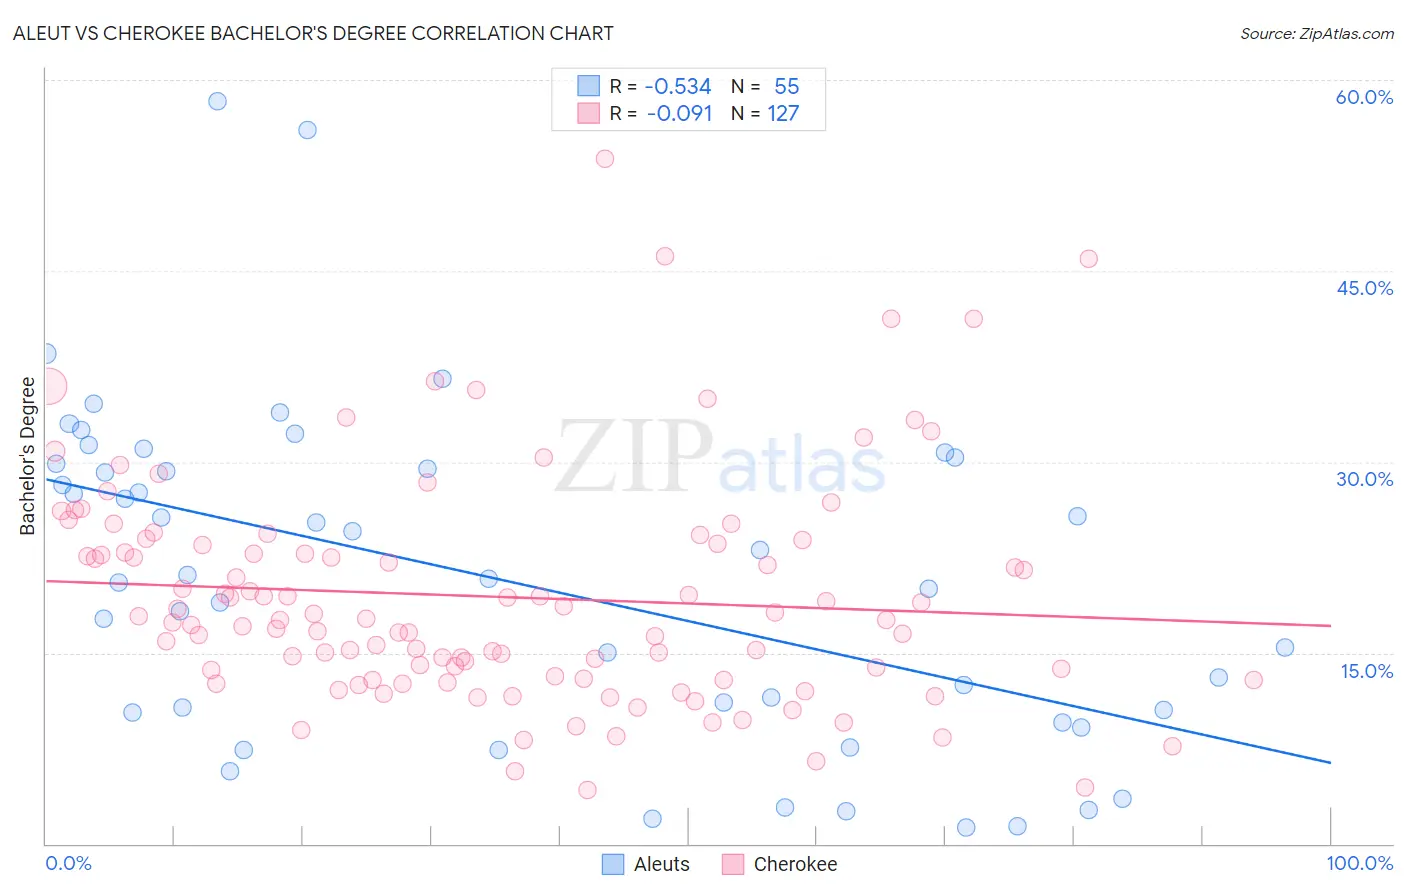
Aleut vs Cherokee Bachelor's Degree Correlation Chart
The statistical analysis conducted on geographies consisting of 61,782,473 people shows a substantial negative correlation between the proportion of Aleuts and percentage of population with at least bachelor's degree education in the United States with a correlation coefficient (R) of -0.534 and weighted average of 31.3%. Similarly, the statistical analysis conducted on geographies consisting of 493,657,197 people shows a slight negative correlation between the proportion of Cherokee and percentage of population with at least bachelor's degree education in the United States with a correlation coefficient (R) of -0.091 and weighted average of 30.2%, a difference of 3.7%.
Bachelor's Degree Correlation Summary
| Measurement | Aleut | Cherokee |
| Minimum | 1.3% | 4.3% |
| Maximum | 58.3% | 53.8% |
| Range | 57.1% | 49.6% |
| Mean | 20.8% | 19.4% |
| Median | 20.9% | 17.6% |
| Interquartile 25% (IQ1) | 10.3% | 13.0% |
| Interquartile 75% (IQ3) | 29.9% | 23.6% |
| Interquartile Range (IQR) | 19.5% | 10.6% |
| Standard Deviation (Sample) | 13.0% | 8.9% |
| Standard Deviation (Population) | 12.9% | 8.8% |
Demographics Similar to Aleuts and Cherokee by Bachelor's Degree
In terms of bachelor's degree, the demographic groups most similar to Aleuts are Haitian (31.3%, a difference of 0.010%), Immigrants from El Salvador (31.3%, a difference of 0.050%), Ottawa (31.1%, a difference of 0.68%), Guatemalan (31.0%, a difference of 1.0%), and Puerto Rican (31.0%, a difference of 1.2%). Similarly, the demographic groups most similar to Cherokee are Bangladeshi (30.2%, a difference of 0.010%), Mexican American Indian (30.2%, a difference of 0.17%), Immigrants from Cuba (30.3%, a difference of 0.45%), Immigrants from Micronesia (30.4%, a difference of 0.67%), and Chickasaw (30.4%, a difference of 0.69%).
| Demographics | Rating | Rank | Bachelor's Degree |
| Haitians | 0.1 /100 | #284 | Tragic 31.3% |
| Aleuts | 0.1 /100 | #285 | Tragic 31.3% |
| Immigrants | El Salvador | 0.1 /100 | #286 | Tragic 31.3% |
| Ottawa | 0.1 /100 | #287 | Tragic 31.1% |
| Guatemalans | 0.1 /100 | #288 | Tragic 31.0% |
| Puerto Ricans | 0.1 /100 | #289 | Tragic 31.0% |
| Immigrants | Honduras | 0.1 /100 | #290 | Tragic 30.9% |
| Blacks/African Americans | 0.1 /100 | #291 | Tragic 30.9% |
| Ute | 0.1 /100 | #292 | Tragic 30.9% |
| Cape Verdeans | 0.1 /100 | #293 | Tragic 30.9% |
| Immigrants | Guatemala | 0.0 /100 | #294 | Tragic 30.8% |
| Immigrants | Dominican Republic | 0.0 /100 | #295 | Tragic 30.7% |
| Puget Sound Salish | 0.0 /100 | #296 | Tragic 30.7% |
| Immigrants | Haiti | 0.0 /100 | #297 | Tragic 30.6% |
| Chippewa | 0.0 /100 | #298 | Tragic 30.6% |
| Chickasaw | 0.0 /100 | #299 | Tragic 30.4% |
| Immigrants | Micronesia | 0.0 /100 | #300 | Tragic 30.4% |
| Immigrants | Cuba | 0.0 /100 | #301 | Tragic 30.3% |
| Mexican American Indians | 0.0 /100 | #302 | Tragic 30.2% |
| Bangladeshis | 0.0 /100 | #303 | Tragic 30.2% |
| Cherokee | 0.0 /100 | #304 | Tragic 30.2% |