Immigrants from Greece vs Bulgarian GED/Equivalency
COMPARE
Immigrants from Greece
Bulgarian
GED/Equivalency
GED/Equivalency Comparison
Immigrants from Greece
Bulgarians
87.4%
GED/EQUIVALENCY
97.7/ 100
METRIC RATING
95th/ 347
METRIC RANK
89.0%
GED/EQUIVALENCY
99.9/ 100
METRIC RATING
11th/ 347
METRIC RANK
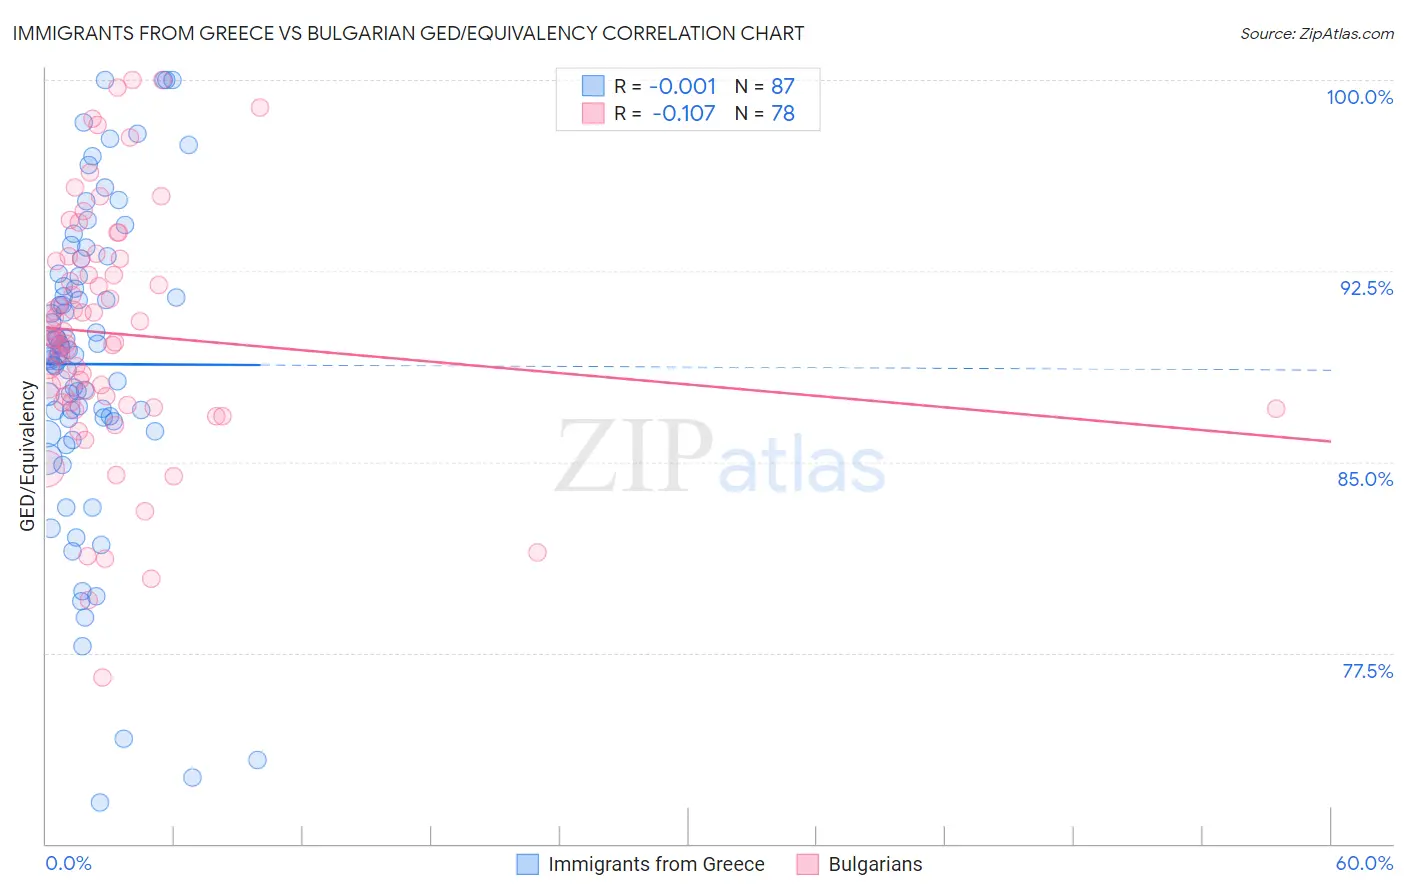
Immigrants from Greece vs Bulgarian GED/Equivalency Correlation Chart
The statistical analysis conducted on geographies consisting of 216,879,847 people shows no correlation between the proportion of Immigrants from Greece and percentage of population with at least ged/equivalency education in the United States with a correlation coefficient (R) of -0.001 and weighted average of 87.4%. Similarly, the statistical analysis conducted on geographies consisting of 205,633,746 people shows a poor negative correlation between the proportion of Bulgarians and percentage of population with at least ged/equivalency education in the United States with a correlation coefficient (R) of -0.107 and weighted average of 89.0%, a difference of 1.8%.
GED/Equivalency Correlation Summary
| Measurement | Immigrants from Greece | Bulgarian |
| Minimum | 71.6% | 76.5% |
| Maximum | 100.0% | 100.0% |
| Range | 28.4% | 23.5% |
| Mean | 88.8% | 90.0% |
| Median | 89.3% | 89.9% |
| Interquartile 25% (IQ1) | 86.6% | 87.3% |
| Interquartile 75% (IQ3) | 92.3% | 93.0% |
| Interquartile Range (IQR) | 5.7% | 5.6% |
| Standard Deviation (Sample) | 6.1% | 4.8% |
| Standard Deviation (Population) | 6.1% | 4.8% |
Similar Demographics by GED/Equivalency
Demographics Similar to Immigrants from Greece by GED/Equivalency
In terms of ged/equivalency, the demographic groups most similar to Immigrants from Greece are Immigrants from North Macedonia (87.4%, a difference of 0.020%), Immigrants from Russia (87.4%, a difference of 0.020%), Czechoslovakian (87.4%, a difference of 0.020%), Israeli (87.4%, a difference of 0.030%), and Immigrants from Eastern Asia (87.4%, a difference of 0.040%).
| Demographics | Rating | Rank | GED/Equivalency |
| Immigrants | Norway | 98.1 /100 | #88 | Exceptional 87.5% |
| Hungarians | 97.9 /100 | #89 | Exceptional 87.4% |
| Welsh | 97.9 /100 | #90 | Exceptional 87.4% |
| Immigrants | Eastern Asia | 97.9 /100 | #91 | Exceptional 87.4% |
| Israelis | 97.8 /100 | #92 | Exceptional 87.4% |
| Immigrants | North Macedonia | 97.8 /100 | #93 | Exceptional 87.4% |
| Immigrants | Russia | 97.8 /100 | #94 | Exceptional 87.4% |
| Immigrants | Greece | 97.7 /100 | #95 | Exceptional 87.4% |
| Czechoslovakians | 97.6 /100 | #96 | Exceptional 87.4% |
| Immigrants | Western Europe | 97.3 /100 | #97 | Exceptional 87.3% |
| Immigrants | Croatia | 96.9 /100 | #98 | Exceptional 87.3% |
| Immigrants | Belarus | 96.9 /100 | #99 | Exceptional 87.3% |
| Palestinians | 96.8 /100 | #100 | Exceptional 87.3% |
| Syrians | 96.6 /100 | #101 | Exceptional 87.2% |
| Lebanese | 96.2 /100 | #102 | Exceptional 87.2% |
Demographics Similar to Bulgarians by GED/Equivalency
In terms of ged/equivalency, the demographic groups most similar to Bulgarians are Norwegian (89.0%, a difference of 0.040%), Lithuanian (88.9%, a difference of 0.040%), Immigrants from Iran (88.9%, a difference of 0.050%), Chinese (89.0%, a difference of 0.080%), and Cypriot (88.9%, a difference of 0.080%).
| Demographics | Rating | Rank | GED/Equivalency |
| Iranians | 100.0 /100 | #4 | Exceptional 89.2% |
| Latvians | 100.0 /100 | #5 | Exceptional 89.2% |
| Thais | 100.0 /100 | #6 | Exceptional 89.1% |
| Eastern Europeans | 99.9 /100 | #7 | Exceptional 89.1% |
| Carpatho Rusyns | 99.9 /100 | #8 | Exceptional 89.1% |
| Chinese | 99.9 /100 | #9 | Exceptional 89.0% |
| Norwegians | 99.9 /100 | #10 | Exceptional 89.0% |
| Bulgarians | 99.9 /100 | #11 | Exceptional 89.0% |
| Lithuanians | 99.9 /100 | #12 | Exceptional 88.9% |
| Immigrants | Iran | 99.9 /100 | #13 | Exceptional 88.9% |
| Cypriots | 99.9 /100 | #14 | Exceptional 88.9% |
| Okinawans | 99.9 /100 | #15 | Exceptional 88.9% |
| Immigrants | Taiwan | 99.9 /100 | #16 | Exceptional 88.8% |
| Croatians | 99.9 /100 | #17 | Exceptional 88.8% |
| Slovenes | 99.9 /100 | #18 | Exceptional 88.8% |