Immigrants from Germany vs Serbian No Schooling Completed
COMPARE
Immigrants from Germany
Serbian
No Schooling Completed
No Schooling Completed Comparison
Immigrants from Germany
Serbians
1.8%
NO SCHOOLING COMPLETED
99.0/ 100
METRIC RATING
91st/ 347
METRIC RANK
1.7%
NO SCHOOLING COMPLETED
99.7/ 100
METRIC RATING
65th/ 347
METRIC RANK
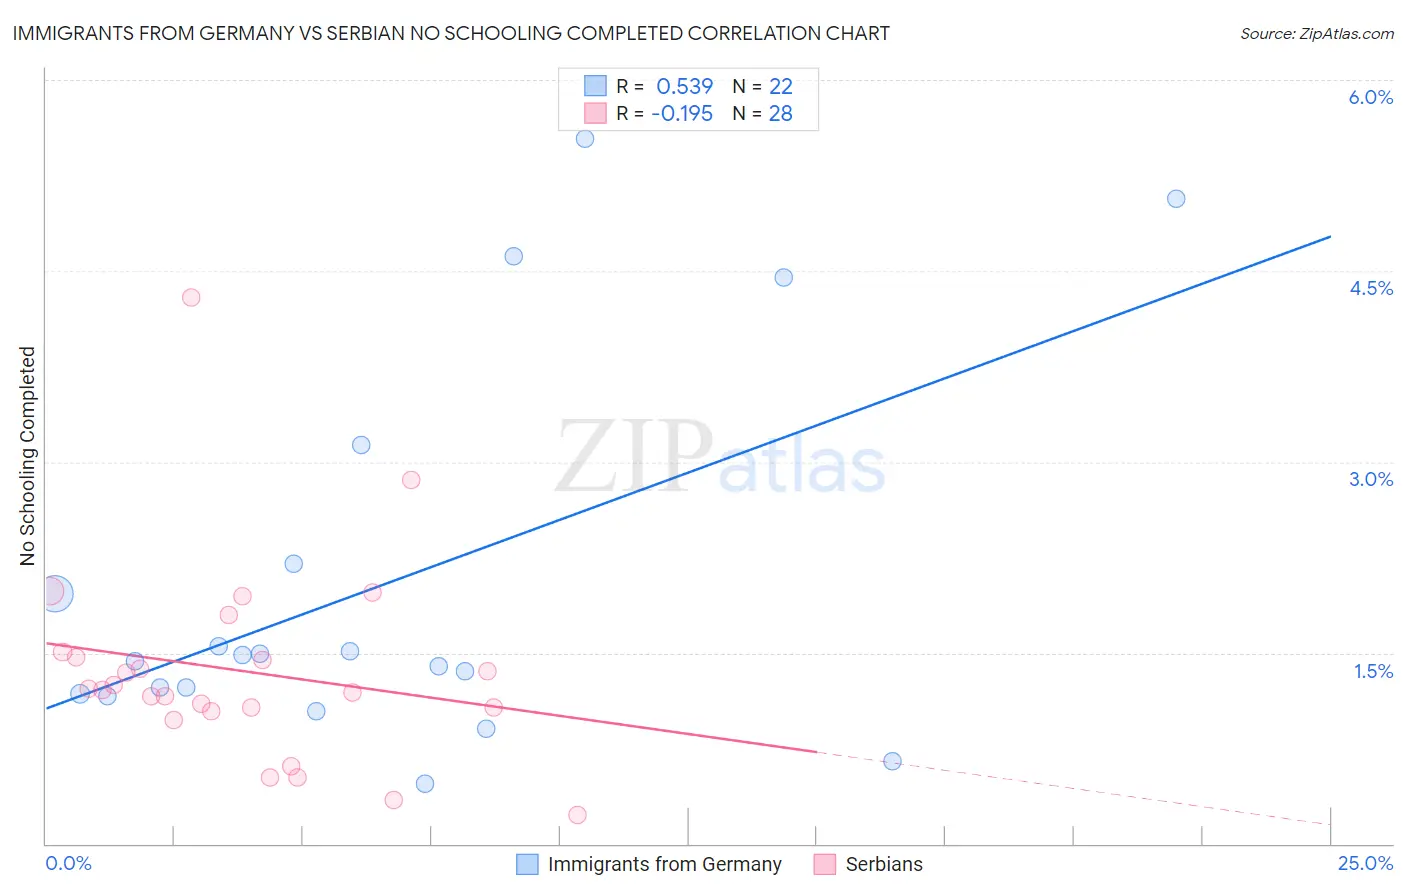
Immigrants from Germany vs Serbian No Schooling Completed Correlation Chart
The statistical analysis conducted on geographies consisting of 457,031,521 people shows a substantial positive correlation between the proportion of Immigrants from Germany and percentage of population with no schooling in the United States with a correlation coefficient (R) of 0.539 and weighted average of 1.8%. Similarly, the statistical analysis conducted on geographies consisting of 265,248,882 people shows a poor negative correlation between the proportion of Serbians and percentage of population with no schooling in the United States with a correlation coefficient (R) of -0.195 and weighted average of 1.7%, a difference of 6.0%.
No Schooling Completed Correlation Summary
| Measurement | Immigrants from Germany | Serbian |
| Minimum | 0.48% | 0.23% |
| Maximum | 5.5% | 4.3% |
| Range | 5.1% | 4.1% |
| Mean | 2.0% | 1.4% |
| Median | 1.5% | 1.2% |
| Interquartile 25% (IQ1) | 1.2% | 1.1% |
| Interquartile 75% (IQ3) | 2.2% | 1.5% |
| Interquartile Range (IQR) | 1.0% | 0.43% |
| Standard Deviation (Sample) | 1.5% | 0.80% |
| Standard Deviation (Population) | 1.5% | 0.78% |
Similar Demographics by No Schooling Completed
Demographics Similar to Immigrants from Germany by No Schooling Completed
In terms of no schooling completed, the demographic groups most similar to Immigrants from Germany are Sioux (1.8%, a difference of 0.11%), Romanian (1.8%, a difference of 0.52%), South African (1.8%, a difference of 0.82%), Immigrants from Western Europe (1.8%, a difference of 0.86%), and Turkish (1.8%, a difference of 0.89%).
| Demographics | Rating | Rank | No Schooling Completed |
| Immigrants | Denmark | 99.2 /100 | #84 | Exceptional 1.7% |
| Immigrants | Australia | 99.2 /100 | #85 | Exceptional 1.7% |
| Ukrainians | 99.2 /100 | #86 | Exceptional 1.8% |
| Osage | 99.2 /100 | #87 | Exceptional 1.8% |
| Immigrants | Western Europe | 99.2 /100 | #88 | Exceptional 1.8% |
| South Africans | 99.1 /100 | #89 | Exceptional 1.8% |
| Sioux | 99.0 /100 | #90 | Exceptional 1.8% |
| Immigrants | Germany | 99.0 /100 | #91 | Exceptional 1.8% |
| Romanians | 98.8 /100 | #92 | Exceptional 1.8% |
| Turks | 98.7 /100 | #93 | Exceptional 1.8% |
| Immigrants | Nonimmigrants | 98.5 /100 | #94 | Exceptional 1.8% |
| Puget Sound Salish | 98.5 /100 | #95 | Exceptional 1.8% |
| Bhutanese | 98.4 /100 | #96 | Exceptional 1.8% |
| Immigrants | Ireland | 98.4 /100 | #97 | Exceptional 1.8% |
| Iranians | 98.2 /100 | #98 | Exceptional 1.8% |
Demographics Similar to Serbians by No Schooling Completed
In terms of no schooling completed, the demographic groups most similar to Serbians are New Zealander (1.7%, a difference of 0.040%), Canadian (1.7%, a difference of 0.14%), Russian (1.7%, a difference of 0.20%), Immigrants from Northern Europe (1.7%, a difference of 0.24%), and Immigrants from Austria (1.7%, a difference of 0.33%).
| Demographics | Rating | Rank | No Schooling Completed |
| Kiowa | 99.8 /100 | #58 | Exceptional 1.6% |
| Slavs | 99.8 /100 | #59 | Exceptional 1.7% |
| Americans | 99.8 /100 | #60 | Exceptional 1.7% |
| Tsimshian | 99.8 /100 | #61 | Exceptional 1.7% |
| Immigrants | Northern Europe | 99.8 /100 | #62 | Exceptional 1.7% |
| Russians | 99.8 /100 | #63 | Exceptional 1.7% |
| New Zealanders | 99.7 /100 | #64 | Exceptional 1.7% |
| Serbians | 99.7 /100 | #65 | Exceptional 1.7% |
| Canadians | 99.7 /100 | #66 | Exceptional 1.7% |
| Immigrants | Austria | 99.7 /100 | #67 | Exceptional 1.7% |
| Immigrants | Lithuania | 99.7 /100 | #68 | Exceptional 1.7% |
| Chickasaw | 99.6 /100 | #69 | Exceptional 1.7% |
| Immigrants | Netherlands | 99.6 /100 | #70 | Exceptional 1.7% |
| Immigrants | England | 99.5 /100 | #71 | Exceptional 1.7% |
| Cajuns | 99.5 /100 | #72 | Exceptional 1.7% |