Lithuanian vs Serbian No Schooling Completed
COMPARE
Lithuanian
Serbian
No Schooling Completed
No Schooling Completed Comparison
Lithuanians
Serbians
1.4%
NO SCHOOLING COMPLETED
100.0/ 100
METRIC RATING
11th/ 347
METRIC RANK
1.7%
NO SCHOOLING COMPLETED
99.7/ 100
METRIC RATING
65th/ 347
METRIC RANK
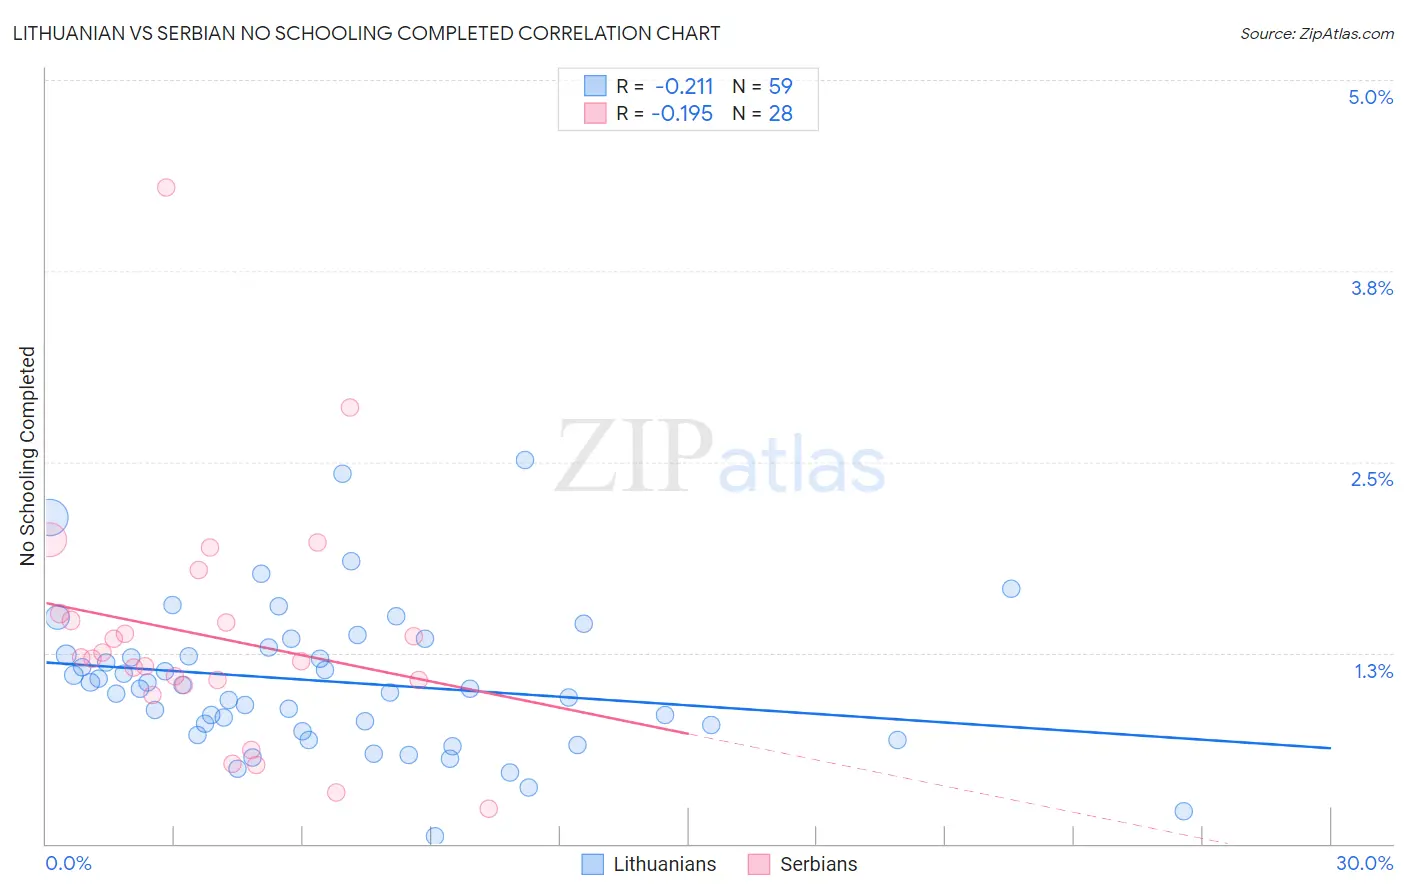
Lithuanian vs Serbian No Schooling Completed Correlation Chart
The statistical analysis conducted on geographies consisting of 415,193,435 people shows a weak negative correlation between the proportion of Lithuanians and percentage of population with no schooling in the United States with a correlation coefficient (R) of -0.211 and weighted average of 1.4%. Similarly, the statistical analysis conducted on geographies consisting of 265,248,882 people shows a poor negative correlation between the proportion of Serbians and percentage of population with no schooling in the United States with a correlation coefficient (R) of -0.195 and weighted average of 1.7%, a difference of 16.3%.
No Schooling Completed Correlation Summary
| Measurement | Lithuanian | Serbian |
| Minimum | 0.047% | 0.23% |
| Maximum | 2.5% | 4.3% |
| Range | 2.5% | 4.1% |
| Mean | 1.1% | 1.4% |
| Median | 1.0% | 1.2% |
| Interquartile 25% (IQ1) | 0.74% | 1.1% |
| Interquartile 75% (IQ3) | 1.3% | 1.5% |
| Interquartile Range (IQR) | 0.55% | 0.43% |
| Standard Deviation (Sample) | 0.48% | 0.80% |
| Standard Deviation (Population) | 0.47% | 0.78% |
Similar Demographics by No Schooling Completed
Demographics Similar to Lithuanians by No Schooling Completed
In terms of no schooling completed, the demographic groups most similar to Lithuanians are Irish (1.4%, a difference of 0.030%), Polish (1.4%, a difference of 0.050%), Dutch (1.4%, a difference of 0.84%), Scotch-Irish (1.5%, a difference of 1.0%), and Tlingit-Haida (1.5%, a difference of 1.1%).
| Demographics | Rating | Rank | No Schooling Completed |
| Germans | 100.0 /100 | #4 | Exceptional 1.4% |
| Slovenes | 100.0 /100 | #5 | Exceptional 1.4% |
| Carpatho Rusyns | 100.0 /100 | #6 | Exceptional 1.4% |
| English | 100.0 /100 | #7 | Exceptional 1.4% |
| Swedes | 100.0 /100 | #8 | Exceptional 1.4% |
| Scottish | 100.0 /100 | #9 | Exceptional 1.4% |
| Dutch | 100.0 /100 | #10 | Exceptional 1.4% |
| Lithuanians | 100.0 /100 | #11 | Exceptional 1.4% |
| Irish | 100.0 /100 | #12 | Exceptional 1.4% |
| Poles | 100.0 /100 | #13 | Exceptional 1.4% |
| Scotch-Irish | 100.0 /100 | #14 | Exceptional 1.5% |
| Tlingit-Haida | 100.0 /100 | #15 | Exceptional 1.5% |
| Finns | 100.0 /100 | #16 | Exceptional 1.5% |
| Croatians | 100.0 /100 | #17 | Exceptional 1.5% |
| Danes | 100.0 /100 | #18 | Exceptional 1.5% |
Demographics Similar to Serbians by No Schooling Completed
In terms of no schooling completed, the demographic groups most similar to Serbians are New Zealander (1.7%, a difference of 0.040%), Canadian (1.7%, a difference of 0.14%), Russian (1.7%, a difference of 0.20%), Immigrants from Northern Europe (1.7%, a difference of 0.24%), and Immigrants from Austria (1.7%, a difference of 0.33%).
| Demographics | Rating | Rank | No Schooling Completed |
| Kiowa | 99.8 /100 | #58 | Exceptional 1.6% |
| Slavs | 99.8 /100 | #59 | Exceptional 1.7% |
| Americans | 99.8 /100 | #60 | Exceptional 1.7% |
| Tsimshian | 99.8 /100 | #61 | Exceptional 1.7% |
| Immigrants | Northern Europe | 99.8 /100 | #62 | Exceptional 1.7% |
| Russians | 99.8 /100 | #63 | Exceptional 1.7% |
| New Zealanders | 99.7 /100 | #64 | Exceptional 1.7% |
| Serbians | 99.7 /100 | #65 | Exceptional 1.7% |
| Canadians | 99.7 /100 | #66 | Exceptional 1.7% |
| Immigrants | Austria | 99.7 /100 | #67 | Exceptional 1.7% |
| Immigrants | Lithuania | 99.7 /100 | #68 | Exceptional 1.7% |
| Chickasaw | 99.6 /100 | #69 | Exceptional 1.7% |
| Immigrants | Netherlands | 99.6 /100 | #70 | Exceptional 1.7% |
| Immigrants | England | 99.5 /100 | #71 | Exceptional 1.7% |
| Cajuns | 99.5 /100 | #72 | Exceptional 1.7% |