Immigrants from Germany vs Immigrants from Cameroon No Schooling Completed
COMPARE
Immigrants from Germany
Immigrants from Cameroon
No Schooling Completed
No Schooling Completed Comparison
Immigrants from Germany
Immigrants from Cameroon
1.8%
NO SCHOOLING COMPLETED
99.0/ 100
METRIC RATING
91st/ 347
METRIC RANK
2.5%
NO SCHOOLING COMPLETED
0.1/ 100
METRIC RATING
273rd/ 347
METRIC RANK
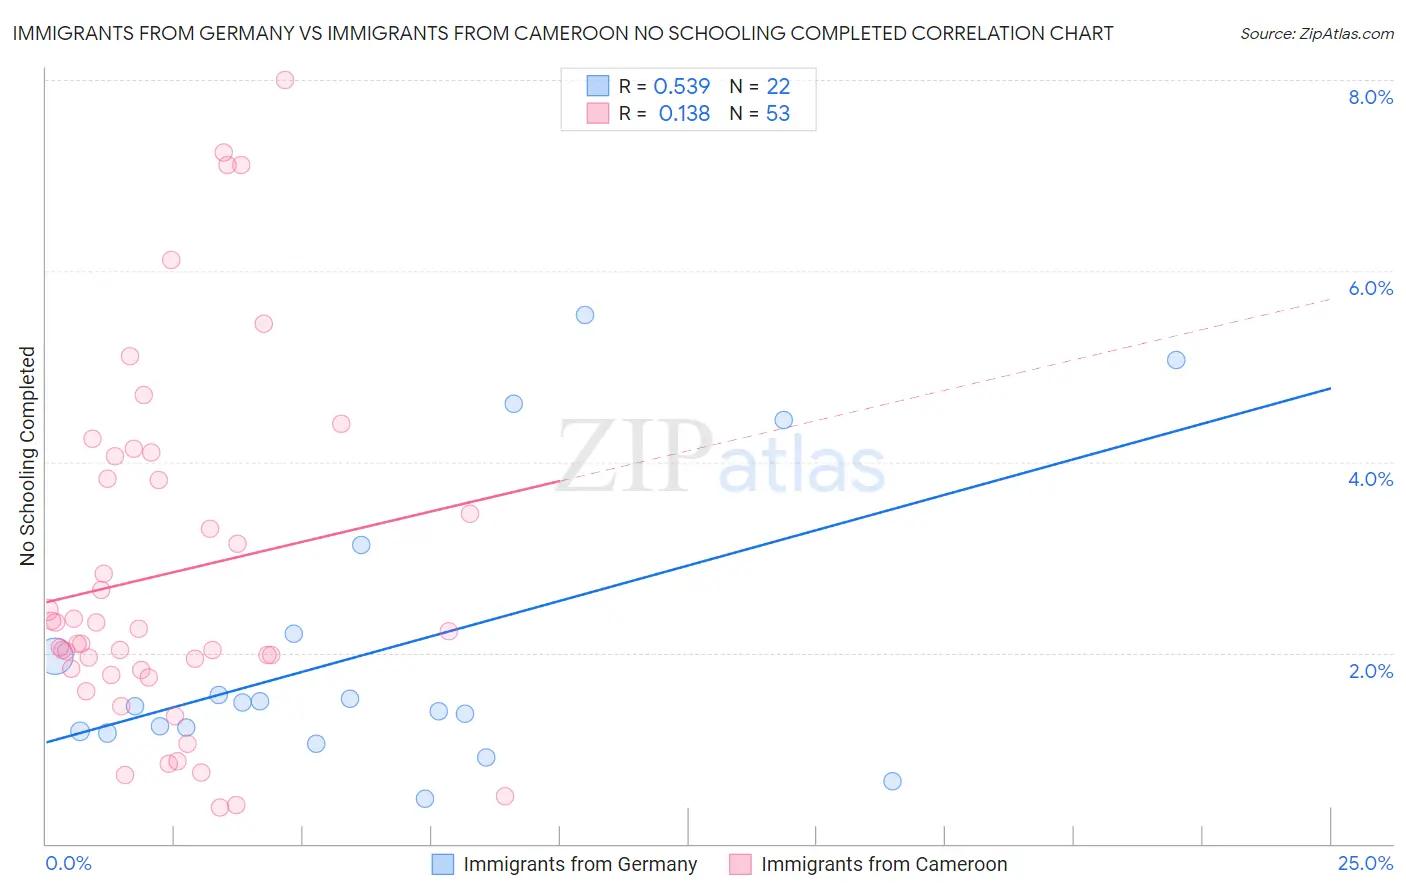
Immigrants from Germany vs Immigrants from Cameroon No Schooling Completed Correlation Chart
The statistical analysis conducted on geographies consisting of 457,031,521 people shows a substantial positive correlation between the proportion of Immigrants from Germany and percentage of population with no schooling in the United States with a correlation coefficient (R) of 0.539 and weighted average of 1.8%. Similarly, the statistical analysis conducted on geographies consisting of 130,544,113 people shows a poor positive correlation between the proportion of Immigrants from Cameroon and percentage of population with no schooling in the United States with a correlation coefficient (R) of 0.138 and weighted average of 2.5%, a difference of 43.8%.
No Schooling Completed Correlation Summary
| Measurement | Immigrants from Germany | Immigrants from Cameroon |
| Minimum | 0.48% | 0.38% |
| Maximum | 5.5% | 8.0% |
| Range | 5.1% | 7.6% |
| Mean | 2.0% | 2.8% |
| Median | 1.5% | 2.2% |
| Interquartile 25% (IQ1) | 1.2% | 1.8% |
| Interquartile 75% (IQ3) | 2.2% | 3.9% |
| Interquartile Range (IQR) | 1.0% | 2.1% |
| Standard Deviation (Sample) | 1.5% | 1.8% |
| Standard Deviation (Population) | 1.5% | 1.8% |
Similar Demographics by No Schooling Completed
Demographics Similar to Immigrants from Germany by No Schooling Completed
In terms of no schooling completed, the demographic groups most similar to Immigrants from Germany are Sioux (1.8%, a difference of 0.11%), Romanian (1.8%, a difference of 0.52%), South African (1.8%, a difference of 0.82%), Immigrants from Western Europe (1.8%, a difference of 0.86%), and Turkish (1.8%, a difference of 0.89%).
| Demographics | Rating | Rank | No Schooling Completed |
| Immigrants | Denmark | 99.2 /100 | #84 | Exceptional 1.7% |
| Immigrants | Australia | 99.2 /100 | #85 | Exceptional 1.7% |
| Ukrainians | 99.2 /100 | #86 | Exceptional 1.8% |
| Osage | 99.2 /100 | #87 | Exceptional 1.8% |
| Immigrants | Western Europe | 99.2 /100 | #88 | Exceptional 1.8% |
| South Africans | 99.1 /100 | #89 | Exceptional 1.8% |
| Sioux | 99.0 /100 | #90 | Exceptional 1.8% |
| Immigrants | Germany | 99.0 /100 | #91 | Exceptional 1.8% |
| Romanians | 98.8 /100 | #92 | Exceptional 1.8% |
| Turks | 98.7 /100 | #93 | Exceptional 1.8% |
| Immigrants | Nonimmigrants | 98.5 /100 | #94 | Exceptional 1.8% |
| Puget Sound Salish | 98.5 /100 | #95 | Exceptional 1.8% |
| Bhutanese | 98.4 /100 | #96 | Exceptional 1.8% |
| Immigrants | Ireland | 98.4 /100 | #97 | Exceptional 1.8% |
| Iranians | 98.2 /100 | #98 | Exceptional 1.8% |
Demographics Similar to Immigrants from Cameroon by No Schooling Completed
In terms of no schooling completed, the demographic groups most similar to Immigrants from Cameroon are Ghanaian (2.6%, a difference of 0.37%), Immigrants from China (2.6%, a difference of 0.56%), Immigrants from Bolivia (2.5%, a difference of 0.79%), Immigrants from Western Africa (2.6%, a difference of 1.1%), and Immigrants from Philippines (2.6%, a difference of 1.2%).
| Demographics | Rating | Rank | No Schooling Completed |
| Fijians | 0.4 /100 | #266 | Tragic 2.5% |
| Yuman | 0.4 /100 | #267 | Tragic 2.5% |
| Taiwanese | 0.3 /100 | #268 | Tragic 2.5% |
| Immigrants | Nigeria | 0.2 /100 | #269 | Tragic 2.5% |
| Immigrants | Peru | 0.2 /100 | #270 | Tragic 2.5% |
| Cubans | 0.2 /100 | #271 | Tragic 2.5% |
| Immigrants | Bolivia | 0.2 /100 | #272 | Tragic 2.5% |
| Immigrants | Cameroon | 0.1 /100 | #273 | Tragic 2.5% |
| Ghanaians | 0.1 /100 | #274 | Tragic 2.6% |
| Immigrants | China | 0.1 /100 | #275 | Tragic 2.6% |
| Immigrants | Western Africa | 0.1 /100 | #276 | Tragic 2.6% |
| Immigrants | Philippines | 0.1 /100 | #277 | Tragic 2.6% |
| Immigrants | Uzbekistan | 0.1 /100 | #278 | Tragic 2.6% |
| Barbadians | 0.1 /100 | #279 | Tragic 2.6% |
| Trinidadians and Tobagonians | 0.1 /100 | #280 | Tragic 2.6% |