Immigrants from Germany vs Immigrants from Cameroon Seniors Poverty Over the Age of 75
COMPARE
Immigrants from Germany
Immigrants from Cameroon
Seniors Poverty Over the Age of 75
Seniors Poverty Over the Age of 75 Comparison
Immigrants from Germany
Immigrants from Cameroon
11.5%
SENIORS POVERTY OVER THE AGE OF 75
94.1/ 100
METRIC RATING
91st/ 347
METRIC RANK
12.0%
SENIORS POVERTY OVER THE AGE OF 75
71.7/ 100
METRIC RATING
141st/ 347
METRIC RANK
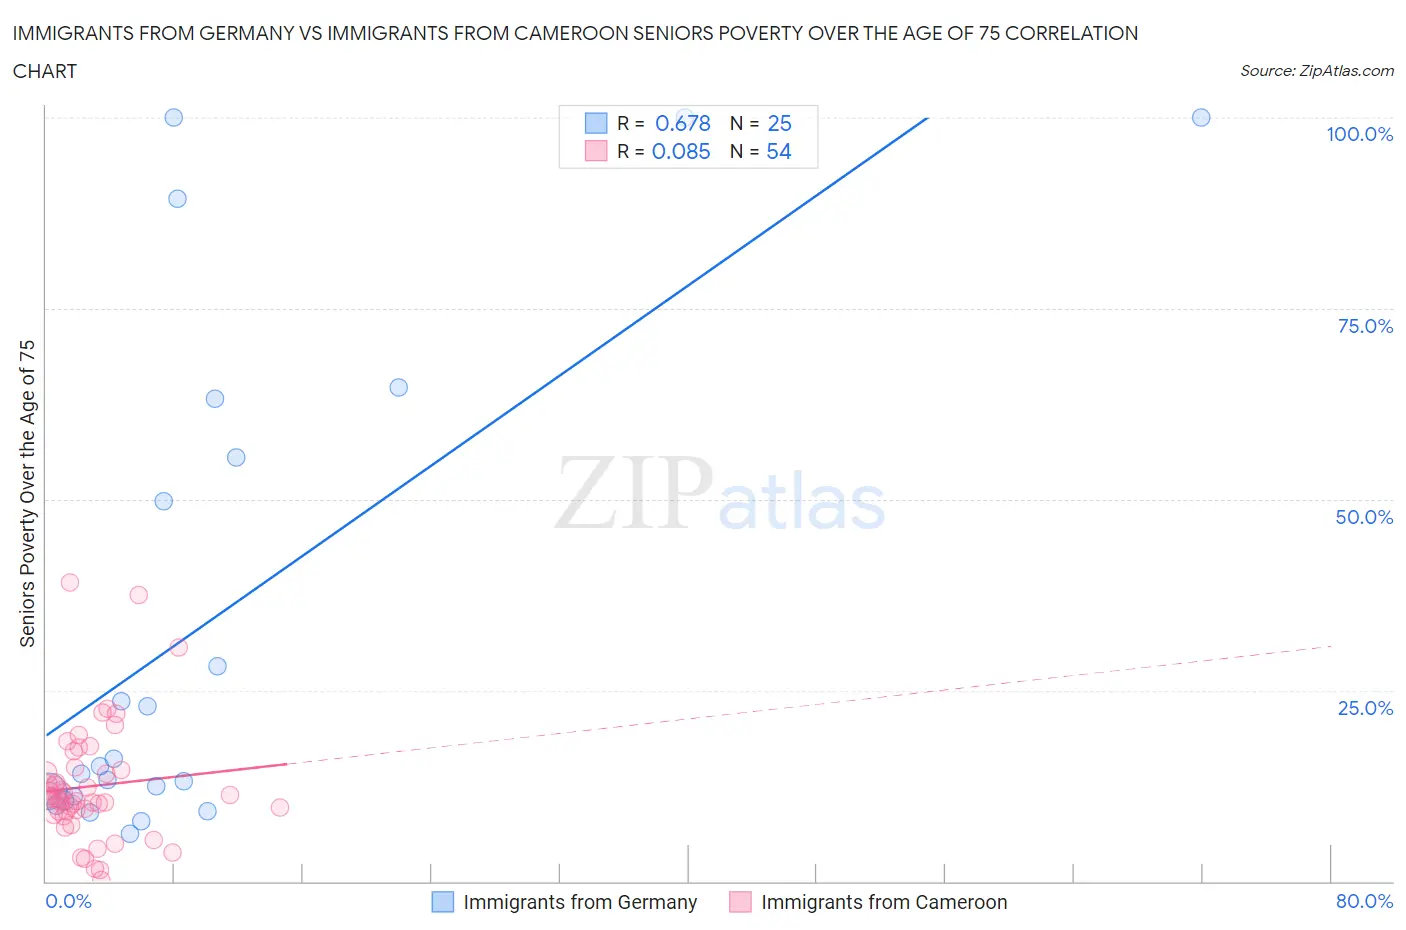
Immigrants from Germany vs Immigrants from Cameroon Seniors Poverty Over the Age of 75 Correlation Chart
The statistical analysis conducted on geographies consisting of 457,232,902 people shows a significant positive correlation between the proportion of Immigrants from Germany and poverty level among seniors over the age of 75 in the United States with a correlation coefficient (R) of 0.678 and weighted average of 11.5%. Similarly, the statistical analysis conducted on geographies consisting of 130,036,589 people shows a slight positive correlation between the proportion of Immigrants from Cameroon and poverty level among seniors over the age of 75 in the United States with a correlation coefficient (R) of 0.085 and weighted average of 12.0%, a difference of 4.0%.
Seniors Poverty Over the Age of 75 Correlation Summary
| Measurement | Immigrants from Germany | Immigrants from Cameroon |
| Minimum | 6.2% | 0.14% |
| Maximum | 100.0% | 39.1% |
| Range | 93.8% | 38.9% |
| Mean | 34.3% | 12.4% |
| Median | 15.1% | 10.7% |
| Interquartile 25% (IQ1) | 10.8% | 9.2% |
| Interquartile 75% (IQ3) | 59.4% | 14.6% |
| Interquartile Range (IQR) | 48.6% | 5.4% |
| Standard Deviation (Sample) | 33.0% | 7.8% |
| Standard Deviation (Population) | 32.3% | 7.7% |
Similar Demographics by Seniors Poverty Over the Age of 75
Demographics Similar to Immigrants from Germany by Seniors Poverty Over the Age of 75
In terms of seniors poverty over the age of 75, the demographic groups most similar to Immigrants from Germany are Aleut (11.5%, a difference of 0.020%), Kenyan (11.5%, a difference of 0.070%), Immigrants from Sri Lanka (11.5%, a difference of 0.13%), Immigrants from Croatia (11.5%, a difference of 0.16%), and Korean (11.5%, a difference of 0.18%).
| Demographics | Rating | Rank | Seniors Poverty Over the Age of 75 |
| Immigrants | Iraq | 94.9 /100 | #84 | Exceptional 11.5% |
| Immigrants | Bulgaria | 94.7 /100 | #85 | Exceptional 11.5% |
| Australians | 94.6 /100 | #86 | Exceptional 11.5% |
| Koreans | 94.5 /100 | #87 | Exceptional 11.5% |
| Immigrants | Croatia | 94.5 /100 | #88 | Exceptional 11.5% |
| Immigrants | Sri Lanka | 94.4 /100 | #89 | Exceptional 11.5% |
| Aleuts | 94.1 /100 | #90 | Exceptional 11.5% |
| Immigrants | Germany | 94.1 /100 | #91 | Exceptional 11.5% |
| Kenyans | 93.9 /100 | #92 | Exceptional 11.5% |
| Immigrants | Poland | 92.9 /100 | #93 | Exceptional 11.6% |
| Creek | 92.7 /100 | #94 | Exceptional 11.6% |
| Immigrants | Bosnia and Herzegovina | 92.6 /100 | #95 | Exceptional 11.6% |
| Immigrants | Sweden | 92.6 /100 | #96 | Exceptional 11.6% |
| Romanians | 92.3 /100 | #97 | Exceptional 11.6% |
| Immigrants | Japan | 91.9 /100 | #98 | Exceptional 11.6% |
Demographics Similar to Immigrants from Cameroon by Seniors Poverty Over the Age of 75
In terms of seniors poverty over the age of 75, the demographic groups most similar to Immigrants from Cameroon are Immigrants from Pakistan (12.0%, a difference of 0.020%), Immigrants from Laos (12.0%, a difference of 0.030%), Immigrants from Kenya (11.9%, a difference of 0.080%), American (12.0%, a difference of 0.080%), and Immigrants from Romania (11.9%, a difference of 0.090%).
| Demographics | Rating | Rank | Seniors Poverty Over the Age of 75 |
| Ugandans | 77.1 /100 | #134 | Good 11.9% |
| Immigrants | Ireland | 76.2 /100 | #135 | Good 11.9% |
| Immigrants | Philippines | 75.0 /100 | #136 | Good 11.9% |
| Immigrants | Moldova | 74.1 /100 | #137 | Good 11.9% |
| Immigrants | Romania | 72.6 /100 | #138 | Good 11.9% |
| Immigrants | Kenya | 72.6 /100 | #139 | Good 11.9% |
| Immigrants | Pakistan | 71.9 /100 | #140 | Good 12.0% |
| Immigrants | Cameroon | 71.7 /100 | #141 | Good 12.0% |
| Immigrants | Laos | 71.5 /100 | #142 | Good 12.0% |
| Americans | 71.0 /100 | #143 | Good 12.0% |
| Hmong | 70.8 /100 | #144 | Good 12.0% |
| Immigrants | Belgium | 70.8 /100 | #145 | Good 12.0% |
| Bangladeshis | 70.4 /100 | #146 | Good 12.0% |
| Immigrants | Latvia | 69.1 /100 | #147 | Good 12.0% |
| Immigrants | Zaire | 67.6 /100 | #148 | Good 12.0% |