Immigrants from France vs Immigrants from Japan GED/Equivalency
COMPARE
Immigrants from France
Immigrants from Japan
GED/Equivalency
GED/Equivalency Comparison
Immigrants from France
Immigrants from Japan
87.8%
GED/EQUIVALENCY
99.1/ 100
METRIC RATING
68th/ 347
METRIC RANK
88.4%
GED/EQUIVALENCY
99.7/ 100
METRIC RATING
34th/ 347
METRIC RANK
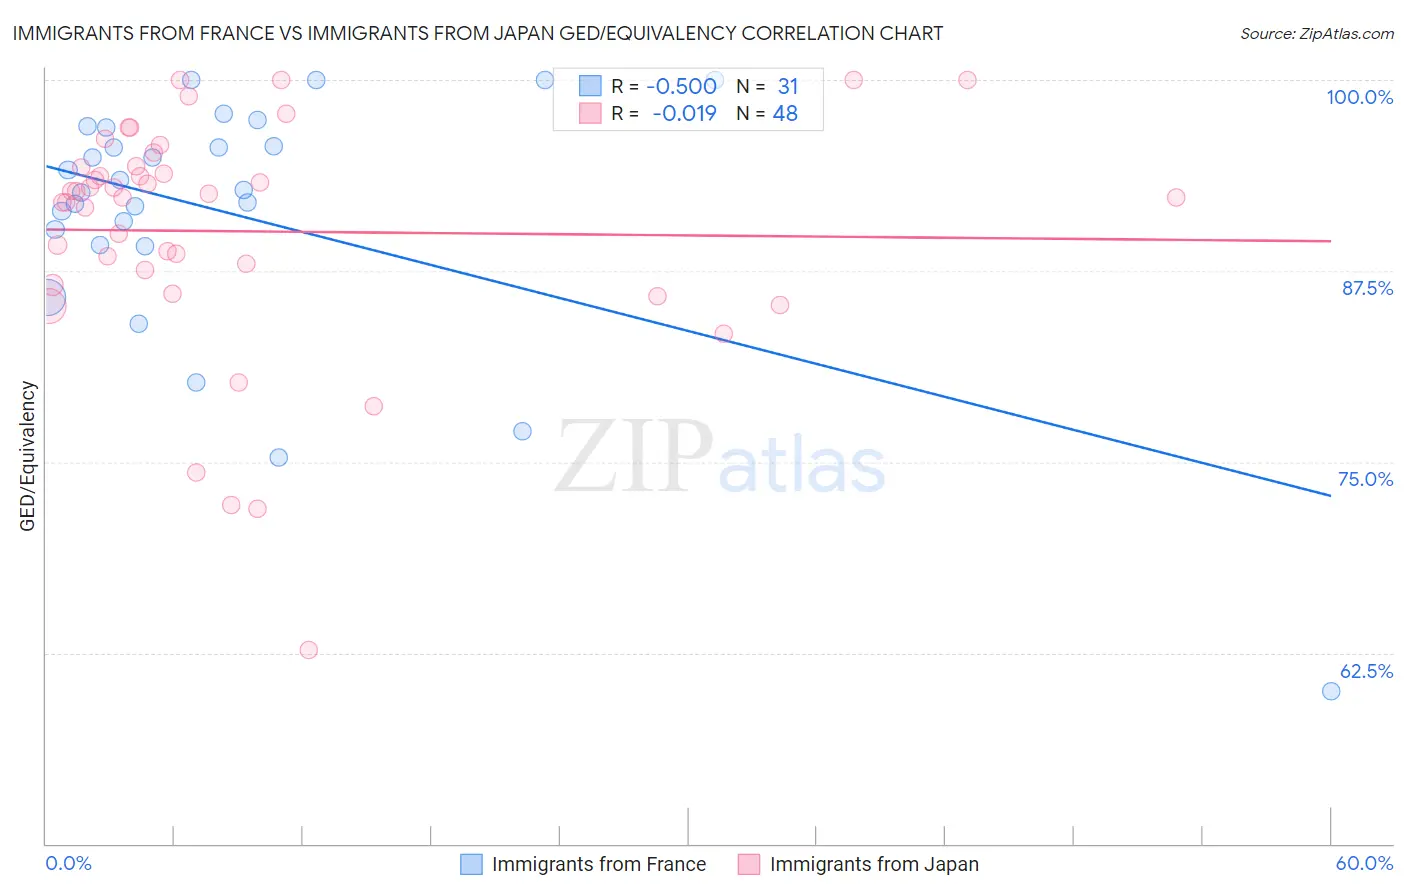
Immigrants from France vs Immigrants from Japan GED/Equivalency Correlation Chart
The statistical analysis conducted on geographies consisting of 287,920,906 people shows a substantial negative correlation between the proportion of Immigrants from France and percentage of population with at least ged/equivalency education in the United States with a correlation coefficient (R) of -0.500 and weighted average of 87.8%. Similarly, the statistical analysis conducted on geographies consisting of 340,148,851 people shows no correlation between the proportion of Immigrants from Japan and percentage of population with at least ged/equivalency education in the United States with a correlation coefficient (R) of -0.019 and weighted average of 88.4%, a difference of 0.64%.
GED/Equivalency Correlation Summary
| Measurement | Immigrants from France | Immigrants from Japan |
| Minimum | 60.0% | 62.7% |
| Maximum | 100.0% | 100.0% |
| Range | 40.0% | 37.3% |
| Mean | 91.2% | 90.1% |
| Median | 92.8% | 92.4% |
| Interquartile 25% (IQ1) | 89.2% | 87.1% |
| Interquartile 75% (IQ3) | 96.9% | 94.3% |
| Interquartile Range (IQR) | 7.7% | 7.2% |
| Standard Deviation (Sample) | 8.6% | 7.9% |
| Standard Deviation (Population) | 8.4% | 7.8% |
Similar Demographics by GED/Equivalency
Demographics Similar to Immigrants from France by GED/Equivalency
In terms of ged/equivalency, the demographic groups most similar to Immigrants from France are British (87.8%, a difference of 0.0%), Immigrants from Bulgaria (87.8%, a difference of 0.010%), Immigrants from North America (87.8%, a difference of 0.020%), Immigrants from Canada (87.9%, a difference of 0.050%), and Immigrants from Saudi Arabia (87.8%, a difference of 0.070%).
| Demographics | Rating | Rank | GED/Equivalency |
| Europeans | 99.3 /100 | #61 | Exceptional 87.9% |
| Germans | 99.3 /100 | #62 | Exceptional 87.9% |
| Immigrants | Turkey | 99.2 /100 | #63 | Exceptional 87.9% |
| Immigrants | Canada | 99.2 /100 | #64 | Exceptional 87.9% |
| Immigrants | North America | 99.1 /100 | #65 | Exceptional 87.8% |
| Immigrants | Bulgaria | 99.1 /100 | #66 | Exceptional 87.8% |
| British | 99.1 /100 | #67 | Exceptional 87.8% |
| Immigrants | France | 99.1 /100 | #68 | Exceptional 87.8% |
| Immigrants | Saudi Arabia | 99.0 /100 | #69 | Exceptional 87.8% |
| Ukrainians | 98.8 /100 | #70 | Exceptional 87.7% |
| Austrians | 98.8 /100 | #71 | Exceptional 87.7% |
| Immigrants | Moldova | 98.8 /100 | #72 | Exceptional 87.7% |
| Belgians | 98.8 /100 | #73 | Exceptional 87.7% |
| Immigrants | Kuwait | 98.8 /100 | #74 | Exceptional 87.7% |
| Scottish | 98.7 /100 | #75 | Exceptional 87.7% |
Demographics Similar to Immigrants from Japan by GED/Equivalency
In terms of ged/equivalency, the demographic groups most similar to Immigrants from Japan are Immigrants from Sweden (88.4%, a difference of 0.010%), Immigrants from South Central Asia (88.4%, a difference of 0.020%), Immigrants from Belgium (88.3%, a difference of 0.040%), Danish (88.4%, a difference of 0.050%), and Bhutanese (88.4%, a difference of 0.070%).
| Demographics | Rating | Rank | GED/Equivalency |
| Immigrants | Lithuania | 99.8 /100 | #27 | Exceptional 88.6% |
| Immigrants | Northern Europe | 99.8 /100 | #28 | Exceptional 88.5% |
| Poles | 99.8 /100 | #29 | Exceptional 88.5% |
| Turks | 99.8 /100 | #30 | Exceptional 88.5% |
| Bhutanese | 99.8 /100 | #31 | Exceptional 88.4% |
| Danes | 99.8 /100 | #32 | Exceptional 88.4% |
| Immigrants | Sweden | 99.7 /100 | #33 | Exceptional 88.4% |
| Immigrants | Japan | 99.7 /100 | #34 | Exceptional 88.4% |
| Immigrants | South Central Asia | 99.7 /100 | #35 | Exceptional 88.4% |
| Immigrants | Belgium | 99.7 /100 | #36 | Exceptional 88.3% |
| Immigrants | Austria | 99.7 /100 | #37 | Exceptional 88.3% |
| Burmese | 99.7 /100 | #38 | Exceptional 88.3% |
| Immigrants | Israel | 99.6 /100 | #39 | Exceptional 88.2% |
| Italians | 99.6 /100 | #40 | Exceptional 88.2% |
| Finns | 99.6 /100 | #41 | Exceptional 88.2% |