Immigrants from Dominican Republic vs Haitian 10th Grade
COMPARE
Immigrants from Dominican Republic
Haitian
10th Grade
10th Grade Comparison
Immigrants from Dominican Republic
Haitians
88.7%
10TH GRADE
0.0/ 100
METRIC RATING
335th/ 347
METRIC RANK
91.8%
10TH GRADE
0.0/ 100
METRIC RATING
294th/ 347
METRIC RANK
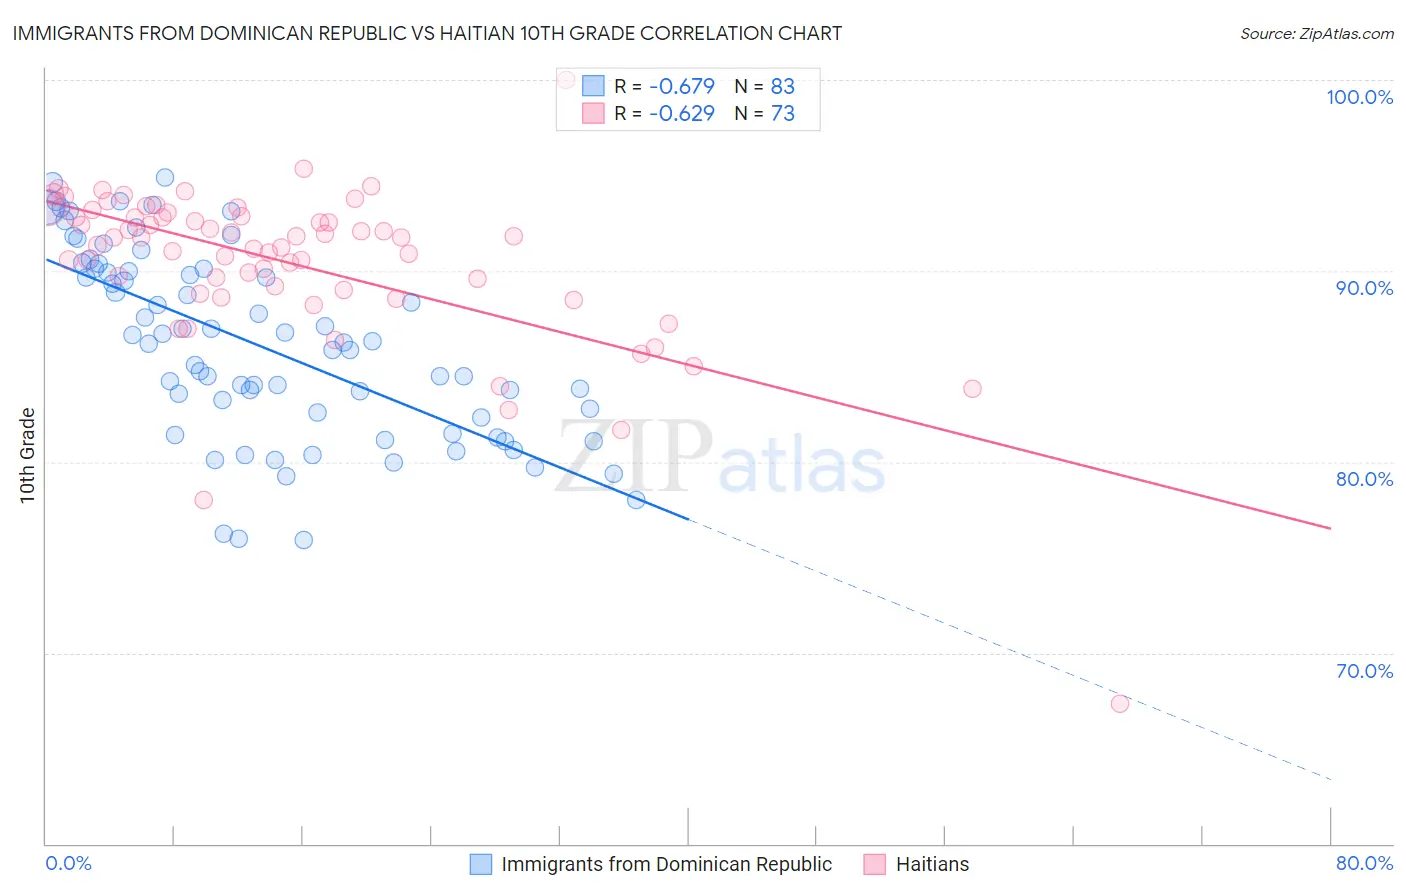
Immigrants from Dominican Republic vs Haitian 10th Grade Correlation Chart
The statistical analysis conducted on geographies consisting of 275,144,349 people shows a significant negative correlation between the proportion of Immigrants from Dominican Republic and percentage of population with at least 10th grade education in the United States with a correlation coefficient (R) of -0.679 and weighted average of 88.7%. Similarly, the statistical analysis conducted on geographies consisting of 288,012,546 people shows a significant negative correlation between the proportion of Haitians and percentage of population with at least 10th grade education in the United States with a correlation coefficient (R) of -0.629 and weighted average of 91.8%, a difference of 3.5%.
10th Grade Correlation Summary
| Measurement | Immigrants from Dominican Republic | Haitian |
| Minimum | 75.9% | 67.3% |
| Maximum | 94.9% | 100.0% |
| Range | 19.0% | 32.7% |
| Mean | 86.1% | 90.4% |
| Median | 86.3% | 91.7% |
| Interquartile 25% (IQ1) | 82.4% | 88.9% |
| Interquartile 75% (IQ3) | 90.1% | 92.8% |
| Interquartile Range (IQR) | 7.7% | 3.9% |
| Standard Deviation (Sample) | 4.9% | 4.4% |
| Standard Deviation (Population) | 4.8% | 4.4% |
Similar Demographics by 10th Grade
Demographics Similar to Immigrants from Dominican Republic by 10th Grade
In terms of 10th grade, the demographic groups most similar to Immigrants from Dominican Republic are Hispanic or Latino (88.9%, a difference of 0.18%), Immigrants from Honduras (88.5%, a difference of 0.19%), Honduran (89.0%, a difference of 0.30%), Immigrants from the Azores (89.0%, a difference of 0.33%), and Central American (88.4%, a difference of 0.35%).
| Demographics | Rating | Rank | 10th Grade |
| Immigrants | Cabo Verde | 0.0 /100 | #328 | Tragic 89.5% |
| Dominicans | 0.0 /100 | #329 | Tragic 89.4% |
| Immigrants | Yemen | 0.0 /100 | #330 | Tragic 89.1% |
| Mexican American Indians | 0.0 /100 | #331 | Tragic 89.0% |
| Immigrants | Azores | 0.0 /100 | #332 | Tragic 89.0% |
| Hondurans | 0.0 /100 | #333 | Tragic 89.0% |
| Hispanics or Latinos | 0.0 /100 | #334 | Tragic 88.9% |
| Immigrants | Dominican Republic | 0.0 /100 | #335 | Tragic 88.7% |
| Immigrants | Honduras | 0.0 /100 | #336 | Tragic 88.5% |
| Central Americans | 0.0 /100 | #337 | Tragic 88.4% |
| Immigrants | Latin America | 0.0 /100 | #338 | Tragic 88.3% |
| Guatemalans | 0.0 /100 | #339 | Tragic 87.9% |
| Mexicans | 0.0 /100 | #340 | Tragic 87.8% |
| Salvadorans | 0.0 /100 | #341 | Tragic 87.5% |
| Immigrants | Guatemala | 0.0 /100 | #342 | Tragic 87.4% |
Demographics Similar to Haitians by 10th Grade
In terms of 10th grade, the demographic groups most similar to Haitians are Indonesian (91.8%, a difference of 0.030%), Lumbee (91.7%, a difference of 0.030%), Immigrants from Burma/Myanmar (91.8%, a difference of 0.050%), British West Indian (91.8%, a difference of 0.060%), and Immigrants from West Indies (91.8%, a difference of 0.060%).
| Demographics | Rating | Rank | 10th Grade |
| Pennsylvania Germans | 0.0 /100 | #287 | Tragic 91.9% |
| Immigrants | Laos | 0.0 /100 | #288 | Tragic 91.9% |
| Sri Lankans | 0.0 /100 | #289 | Tragic 91.8% |
| British West Indians | 0.0 /100 | #290 | Tragic 91.8% |
| Immigrants | West Indies | 0.0 /100 | #291 | Tragic 91.8% |
| Immigrants | Burma/Myanmar | 0.0 /100 | #292 | Tragic 91.8% |
| Indonesians | 0.0 /100 | #293 | Tragic 91.8% |
| Haitians | 0.0 /100 | #294 | Tragic 91.8% |
| Lumbee | 0.0 /100 | #295 | Tragic 91.7% |
| Immigrants | Grenada | 0.0 /100 | #296 | Tragic 91.6% |
| Fijians | 0.0 /100 | #297 | Tragic 91.5% |
| Cubans | 0.0 /100 | #298 | Tragic 91.5% |
| Immigrants | Haiti | 0.0 /100 | #299 | Tragic 91.4% |
| Guyanese | 0.0 /100 | #300 | Tragic 91.4% |
| Japanese | 0.0 /100 | #301 | Tragic 91.2% |