Immigrants from Cuba vs Arapaho 10th Grade
COMPARE
Immigrants from Cuba
Arapaho
10th Grade
10th Grade Comparison
Immigrants from Cuba
Arapaho
90.2%
10TH GRADE
0.0/ 100
METRIC RATING
318th/ 347
METRIC RANK
94.2%
10TH GRADE
90.5/ 100
METRIC RATING
137th/ 347
METRIC RANK
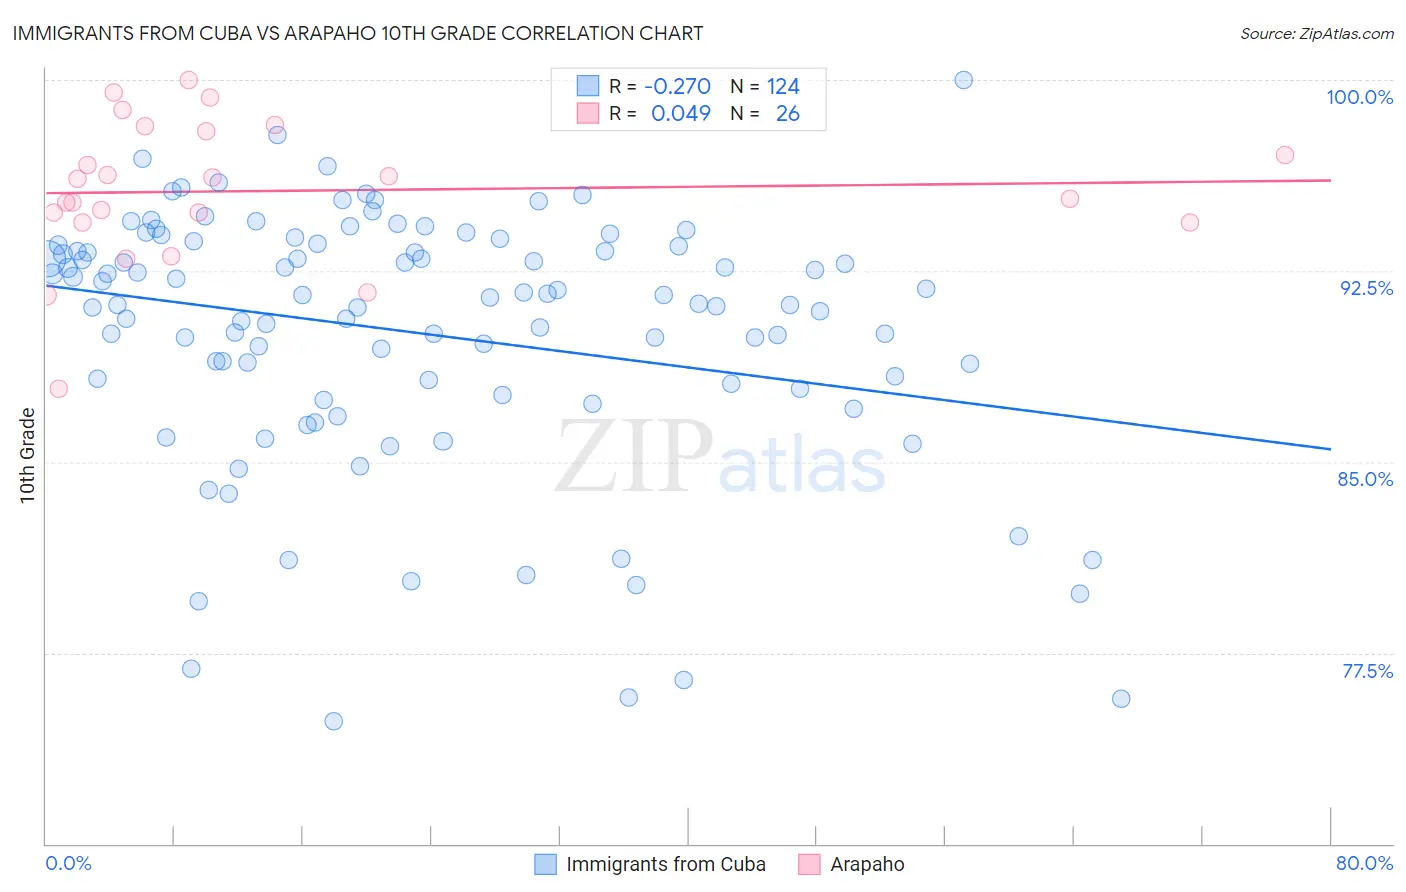
Immigrants from Cuba vs Arapaho 10th Grade Correlation Chart
The statistical analysis conducted on geographies consisting of 326,019,170 people shows a weak negative correlation between the proportion of Immigrants from Cuba and percentage of population with at least 10th grade education in the United States with a correlation coefficient (R) of -0.270 and weighted average of 90.2%. Similarly, the statistical analysis conducted on geographies consisting of 29,780,040 people shows no correlation between the proportion of Arapaho and percentage of population with at least 10th grade education in the United States with a correlation coefficient (R) of 0.049 and weighted average of 94.2%, a difference of 4.4%.
10th Grade Correlation Summary
| Measurement | Immigrants from Cuba | Arapaho |
| Minimum | 74.8% | 87.9% |
| Maximum | 100.0% | 100.0% |
| Range | 25.2% | 12.1% |
| Mean | 90.1% | 95.6% |
| Median | 91.3% | 95.7% |
| Interquartile 25% (IQ1) | 88.0% | 94.4% |
| Interquartile 75% (IQ3) | 93.5% | 98.0% |
| Interquartile Range (IQR) | 5.5% | 3.6% |
| Standard Deviation (Sample) | 5.0% | 2.8% |
| Standard Deviation (Population) | 5.0% | 2.7% |
Similar Demographics by 10th Grade
Demographics Similar to Immigrants from Cuba by 10th Grade
In terms of 10th grade, the demographic groups most similar to Immigrants from Cuba are Nicaraguan (90.2%, a difference of 0.080%), Houma (90.2%, a difference of 0.090%), Belizean (90.2%, a difference of 0.090%), Tohono O'odham (90.1%, a difference of 0.10%), and Immigrants from Belize (90.1%, a difference of 0.19%).
| Demographics | Rating | Rank | 10th Grade |
| Immigrants | Cambodia | 0.0 /100 | #311 | Tragic 90.9% |
| Immigrants | Portugal | 0.0 /100 | #312 | Tragic 90.8% |
| Cape Verdeans | 0.0 /100 | #313 | Tragic 90.8% |
| Nepalese | 0.0 /100 | #314 | Tragic 90.7% |
| Immigrants | Caribbean | 0.0 /100 | #315 | Tragic 90.6% |
| Ecuadorians | 0.0 /100 | #316 | Tragic 90.6% |
| Immigrants | Ecuador | 0.0 /100 | #317 | Tragic 90.4% |
| Immigrants | Cuba | 0.0 /100 | #318 | Tragic 90.2% |
| Nicaraguans | 0.0 /100 | #319 | Tragic 90.2% |
| Houma | 0.0 /100 | #320 | Tragic 90.2% |
| Belizeans | 0.0 /100 | #321 | Tragic 90.2% |
| Tohono O'odham | 0.0 /100 | #322 | Tragic 90.1% |
| Immigrants | Belize | 0.0 /100 | #323 | Tragic 90.1% |
| Immigrants | Armenia | 0.0 /100 | #324 | Tragic 89.9% |
| Puerto Ricans | 0.0 /100 | #325 | Tragic 89.8% |
Demographics Similar to Arapaho by 10th Grade
In terms of 10th grade, the demographic groups most similar to Arapaho are Shoshone (94.2%, a difference of 0.010%), Immigrants from Sri Lanka (94.2%, a difference of 0.010%), Immigrants from Korea (94.2%, a difference of 0.020%), Osage (94.2%, a difference of 0.030%), and Immigrants from Bosnia and Herzegovina (94.2%, a difference of 0.030%).
| Demographics | Rating | Rank | 10th Grade |
| Immigrants | Greece | 92.7 /100 | #130 | Exceptional 94.3% |
| Immigrants | Eastern Europe | 92.5 /100 | #131 | Exceptional 94.3% |
| Immigrants | Russia | 92.4 /100 | #132 | Exceptional 94.3% |
| Creek | 91.9 /100 | #133 | Exceptional 94.2% |
| Osage | 91.7 /100 | #134 | Exceptional 94.2% |
| Immigrants | Korea | 91.3 /100 | #135 | Exceptional 94.2% |
| Shoshone | 90.8 /100 | #136 | Exceptional 94.2% |
| Arapaho | 90.5 /100 | #137 | Exceptional 94.2% |
| Immigrants | Sri Lanka | 89.9 /100 | #138 | Excellent 94.2% |
| Immigrants | Bosnia and Herzegovina | 89.4 /100 | #139 | Excellent 94.2% |
| Immigrants | Jordan | 87.6 /100 | #140 | Excellent 94.1% |
| Hmong | 86.6 /100 | #141 | Excellent 94.1% |
| Albanians | 86.5 /100 | #142 | Excellent 94.1% |
| Cherokee | 84.9 /100 | #143 | Excellent 94.1% |
| Immigrants | Kazakhstan | 84.9 /100 | #144 | Excellent 94.1% |