Immigrants from Cuba vs Arapaho 11th Grade
COMPARE
Immigrants from Cuba
Arapaho
11th Grade
11th Grade Comparison
Immigrants from Cuba
Arapaho
88.9%
11TH GRADE
0.0/ 100
METRIC RATING
316th/ 347
METRIC RANK
92.4%
11TH GRADE
35.1/ 100
METRIC RATING
186th/ 347
METRIC RANK
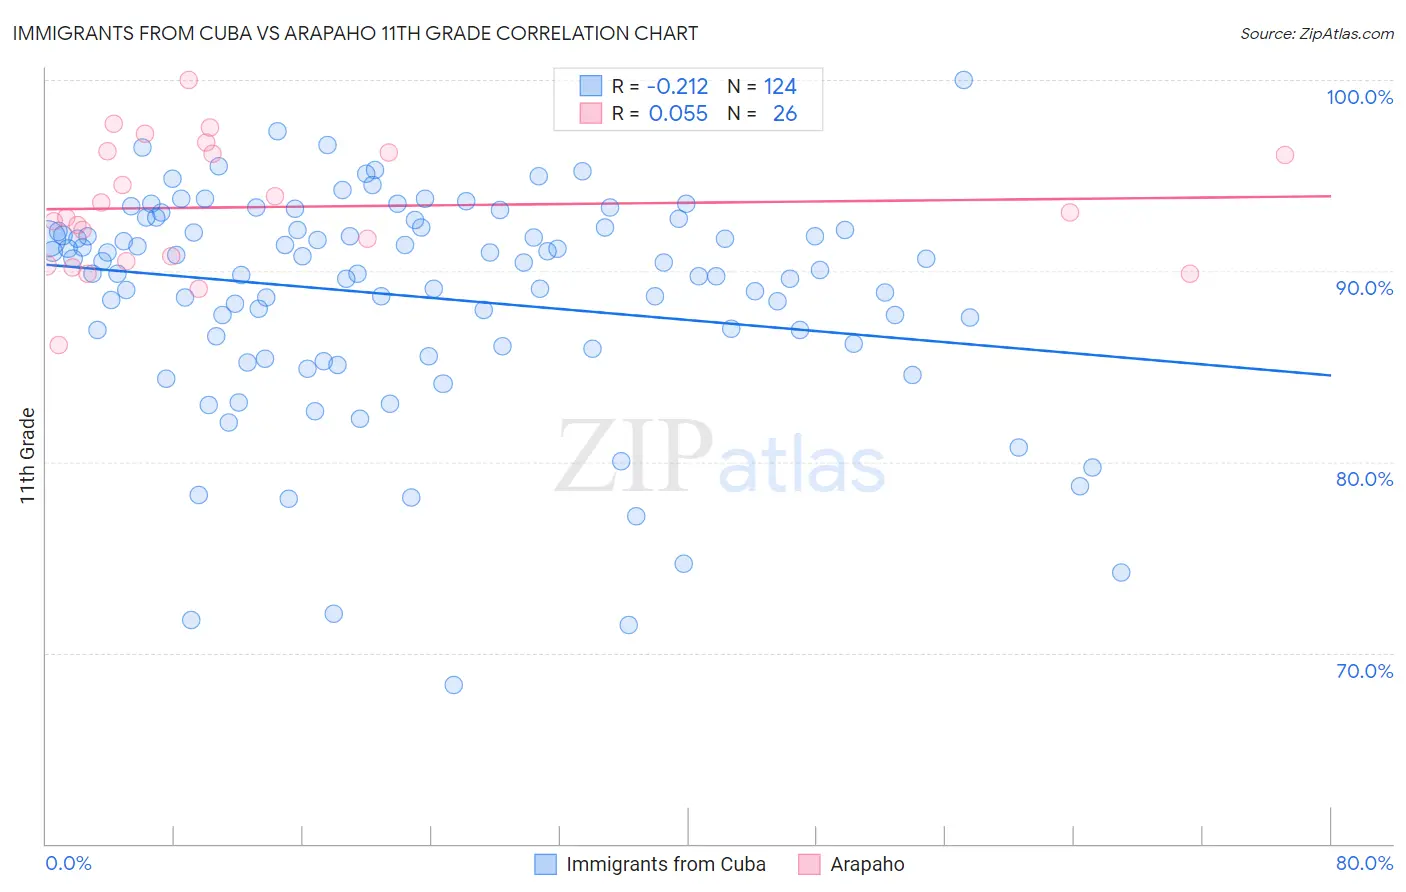
Immigrants from Cuba vs Arapaho 11th Grade Correlation Chart
The statistical analysis conducted on geographies consisting of 326,028,015 people shows a weak negative correlation between the proportion of Immigrants from Cuba and percentage of population with at least 11th grade education in the United States with a correlation coefficient (R) of -0.212 and weighted average of 88.9%. Similarly, the statistical analysis conducted on geographies consisting of 29,780,040 people shows a slight positive correlation between the proportion of Arapaho and percentage of population with at least 11th grade education in the United States with a correlation coefficient (R) of 0.055 and weighted average of 92.4%, a difference of 3.9%.
11th Grade Correlation Summary
| Measurement | Immigrants from Cuba | Arapaho |
| Minimum | 68.3% | 86.1% |
| Maximum | 100.0% | 100.0% |
| Range | 31.7% | 13.9% |
| Mean | 88.7% | 93.4% |
| Median | 90.2% | 92.9% |
| Interquartile 25% (IQ1) | 86.1% | 90.5% |
| Interquartile 75% (IQ3) | 92.2% | 96.2% |
| Interquartile Range (IQR) | 6.1% | 5.7% |
| Standard Deviation (Sample) | 5.8% | 3.3% |
| Standard Deviation (Population) | 5.8% | 3.3% |
Similar Demographics by 11th Grade
Demographics Similar to Immigrants from Cuba by 11th Grade
In terms of 11th grade, the demographic groups most similar to Immigrants from Cuba are Lumbee (88.9%, a difference of 0.010%), Nicaraguan (88.9%, a difference of 0.070%), Immigrants from Ecuador (89.1%, a difference of 0.15%), Cape Verdean (89.1%, a difference of 0.16%), and Belizean (88.8%, a difference of 0.16%).
| Demographics | Rating | Rank | 11th Grade |
| Immigrants | Bangladesh | 0.0 /100 | #309 | Tragic 89.5% |
| Yaqui | 0.0 /100 | #310 | Tragic 89.5% |
| Vietnamese | 0.0 /100 | #311 | Tragic 89.4% |
| Immigrants | Portugal | 0.0 /100 | #312 | Tragic 89.3% |
| Immigrants | Caribbean | 0.0 /100 | #313 | Tragic 89.1% |
| Cape Verdeans | 0.0 /100 | #314 | Tragic 89.1% |
| Immigrants | Ecuador | 0.0 /100 | #315 | Tragic 89.1% |
| Immigrants | Cuba | 0.0 /100 | #316 | Tragic 88.9% |
| Lumbee | 0.0 /100 | #317 | Tragic 88.9% |
| Nicaraguans | 0.0 /100 | #318 | Tragic 88.9% |
| Belizeans | 0.0 /100 | #319 | Tragic 88.8% |
| Immigrants | Armenia | 0.0 /100 | #320 | Tragic 88.8% |
| Immigrants | Belize | 0.0 /100 | #321 | Tragic 88.7% |
| Puerto Ricans | 0.0 /100 | #322 | Tragic 88.4% |
| Pima | 0.0 /100 | #323 | Tragic 88.3% |
Demographics Similar to Arapaho by 11th Grade
In terms of 11th grade, the demographic groups most similar to Arapaho are Immigrants from Western Asia (92.4%, a difference of 0.0%), Immigrants from Nepal (92.4%, a difference of 0.010%), Immigrants from Asia (92.4%, a difference of 0.020%), Immigrants from Indonesia (92.4%, a difference of 0.020%), and Immigrants from Chile (92.4%, a difference of 0.020%).
| Demographics | Rating | Rank | 11th Grade |
| Creek | 40.9 /100 | #179 | Average 92.4% |
| Inupiat | 40.7 /100 | #180 | Average 92.4% |
| Cherokee | 40.7 /100 | #181 | Average 92.4% |
| Immigrants | Morocco | 38.6 /100 | #182 | Fair 92.4% |
| Immigrants | Malaysia | 37.6 /100 | #183 | Fair 92.4% |
| Immigrants | Asia | 37.4 /100 | #184 | Fair 92.4% |
| Immigrants | Nepal | 36.4 /100 | #185 | Fair 92.4% |
| Arapaho | 35.1 /100 | #186 | Fair 92.4% |
| Immigrants | Western Asia | 35.0 /100 | #187 | Fair 92.4% |
| Immigrants | Indonesia | 33.7 /100 | #188 | Fair 92.4% |
| Immigrants | Chile | 33.3 /100 | #189 | Fair 92.4% |
| Chickasaw | 31.4 /100 | #190 | Fair 92.3% |
| French American Indians | 30.8 /100 | #191 | Fair 92.3% |
| Immigrants | Syria | 30.4 /100 | #192 | Fair 92.3% |
| Moroccans | 28.7 /100 | #193 | Fair 92.3% |