Immigrants from Cuba vs Austrian 11th Grade
COMPARE
Immigrants from Cuba
Austrian
11th Grade
11th Grade Comparison
Immigrants from Cuba
Austrians
88.9%
11TH GRADE
0.0/ 100
METRIC RATING
316th/ 347
METRIC RANK
94.0%
11TH GRADE
99.8/ 100
METRIC RATING
62nd/ 347
METRIC RANK
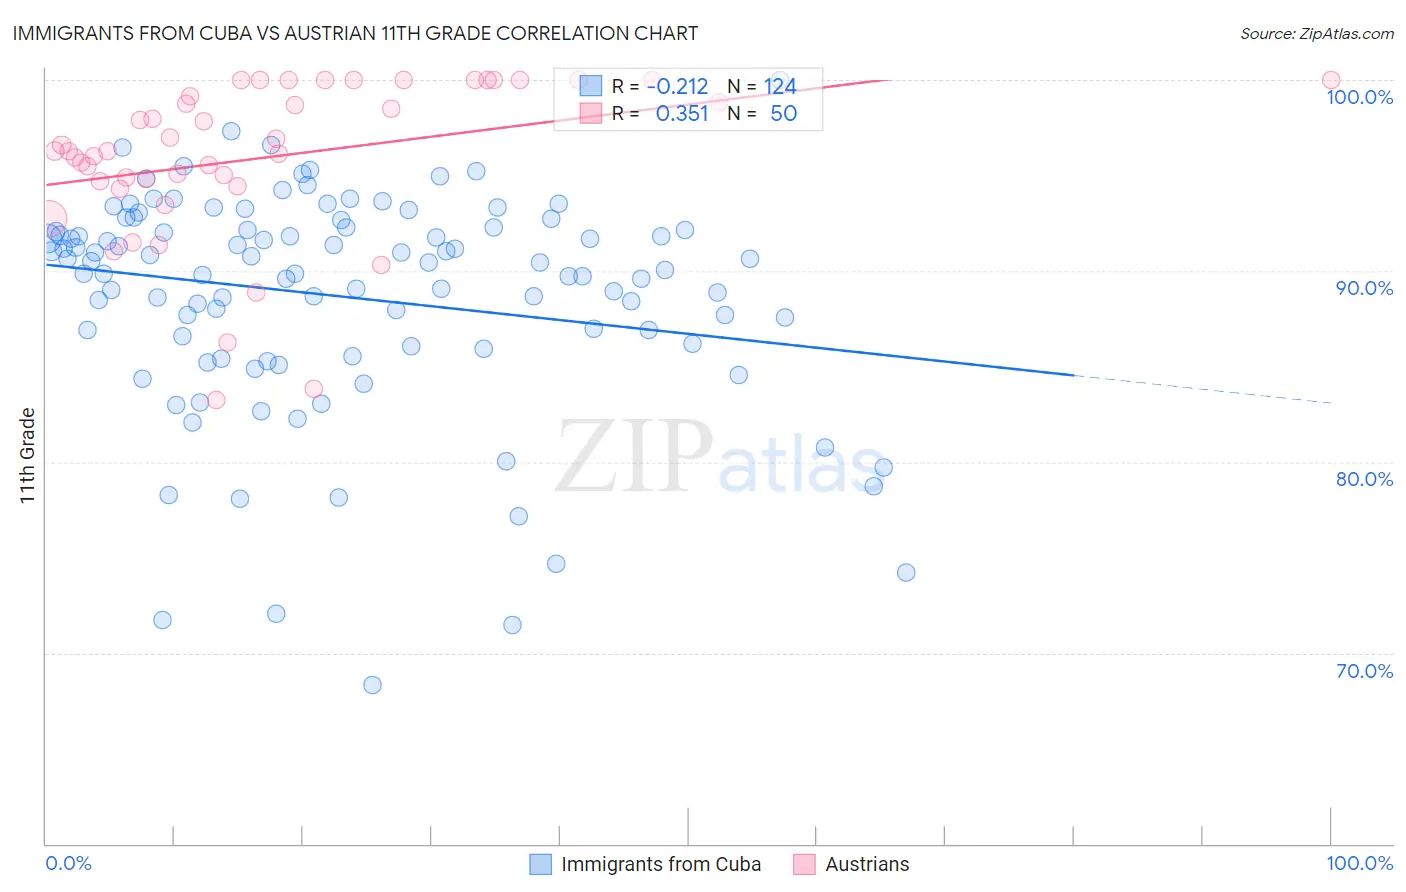
Immigrants from Cuba vs Austrian 11th Grade Correlation Chart
The statistical analysis conducted on geographies consisting of 326,028,015 people shows a weak negative correlation between the proportion of Immigrants from Cuba and percentage of population with at least 11th grade education in the United States with a correlation coefficient (R) of -0.212 and weighted average of 88.9%. Similarly, the statistical analysis conducted on geographies consisting of 452,082,820 people shows a mild positive correlation between the proportion of Austrians and percentage of population with at least 11th grade education in the United States with a correlation coefficient (R) of 0.351 and weighted average of 94.0%, a difference of 5.7%.
11th Grade Correlation Summary
| Measurement | Immigrants from Cuba | Austrian |
| Minimum | 68.3% | 83.3% |
| Maximum | 100.0% | 100.0% |
| Range | 31.7% | 16.7% |
| Mean | 88.7% | 96.0% |
| Median | 90.2% | 96.3% |
| Interquartile 25% (IQ1) | 86.1% | 94.7% |
| Interquartile 75% (IQ3) | 92.2% | 100.0% |
| Interquartile Range (IQR) | 6.1% | 5.3% |
| Standard Deviation (Sample) | 5.8% | 4.1% |
| Standard Deviation (Population) | 5.8% | 4.1% |
Similar Demographics by 11th Grade
Demographics Similar to Immigrants from Cuba by 11th Grade
In terms of 11th grade, the demographic groups most similar to Immigrants from Cuba are Lumbee (88.9%, a difference of 0.010%), Nicaraguan (88.9%, a difference of 0.070%), Immigrants from Ecuador (89.1%, a difference of 0.15%), Cape Verdean (89.1%, a difference of 0.16%), and Belizean (88.8%, a difference of 0.16%).
| Demographics | Rating | Rank | 11th Grade |
| Immigrants | Bangladesh | 0.0 /100 | #309 | Tragic 89.5% |
| Yaqui | 0.0 /100 | #310 | Tragic 89.5% |
| Vietnamese | 0.0 /100 | #311 | Tragic 89.4% |
| Immigrants | Portugal | 0.0 /100 | #312 | Tragic 89.3% |
| Immigrants | Caribbean | 0.0 /100 | #313 | Tragic 89.1% |
| Cape Verdeans | 0.0 /100 | #314 | Tragic 89.1% |
| Immigrants | Ecuador | 0.0 /100 | #315 | Tragic 89.1% |
| Immigrants | Cuba | 0.0 /100 | #316 | Tragic 88.9% |
| Lumbee | 0.0 /100 | #317 | Tragic 88.9% |
| Nicaraguans | 0.0 /100 | #318 | Tragic 88.9% |
| Belizeans | 0.0 /100 | #319 | Tragic 88.8% |
| Immigrants | Armenia | 0.0 /100 | #320 | Tragic 88.8% |
| Immigrants | Belize | 0.0 /100 | #321 | Tragic 88.7% |
| Puerto Ricans | 0.0 /100 | #322 | Tragic 88.4% |
| Pima | 0.0 /100 | #323 | Tragic 88.3% |
Demographics Similar to Austrians by 11th Grade
In terms of 11th grade, the demographic groups most similar to Austrians are Immigrants from Belgium (94.0%, a difference of 0.0%), French Canadian (94.0%, a difference of 0.010%), New Zealander (94.0%, a difference of 0.010%), Iranian (94.0%, a difference of 0.010%), and Bhutanese (94.0%, a difference of 0.010%).
| Demographics | Rating | Rank | 11th Grade |
| Czechoslovakians | 99.9 /100 | #55 | Exceptional 94.0% |
| French Canadians | 99.9 /100 | #56 | Exceptional 94.0% |
| New Zealanders | 99.9 /100 | #57 | Exceptional 94.0% |
| Iranians | 99.9 /100 | #58 | Exceptional 94.0% |
| Bhutanese | 99.8 /100 | #59 | Exceptional 94.0% |
| Okinawans | 99.8 /100 | #60 | Exceptional 94.0% |
| Immigrants | Belgium | 99.8 /100 | #61 | Exceptional 94.0% |
| Austrians | 99.8 /100 | #62 | Exceptional 94.0% |
| Ukrainians | 99.8 /100 | #63 | Exceptional 94.0% |
| Immigrants | Sweden | 99.8 /100 | #64 | Exceptional 93.9% |
| Native Hawaiians | 99.8 /100 | #65 | Exceptional 93.9% |
| Alaskan Athabascans | 99.8 /100 | #66 | Exceptional 93.9% |
| Immigrants | Netherlands | 99.8 /100 | #67 | Exceptional 93.9% |
| Zimbabweans | 99.8 /100 | #68 | Exceptional 93.9% |
| Scotch-Irish | 99.8 /100 | #69 | Exceptional 93.9% |