Immigrants from China vs Immigrants from Uganda 3rd Grade
COMPARE
Immigrants from China
Immigrants from Uganda
3rd Grade
3rd Grade Comparison
Immigrants from China
Immigrants from Uganda
97.2%
3RD GRADE
0.2/ 100
METRIC RATING
270th/ 347
METRIC RANK
97.7%
3RD GRADE
27.4/ 100
METRIC RATING
194th/ 347
METRIC RANK
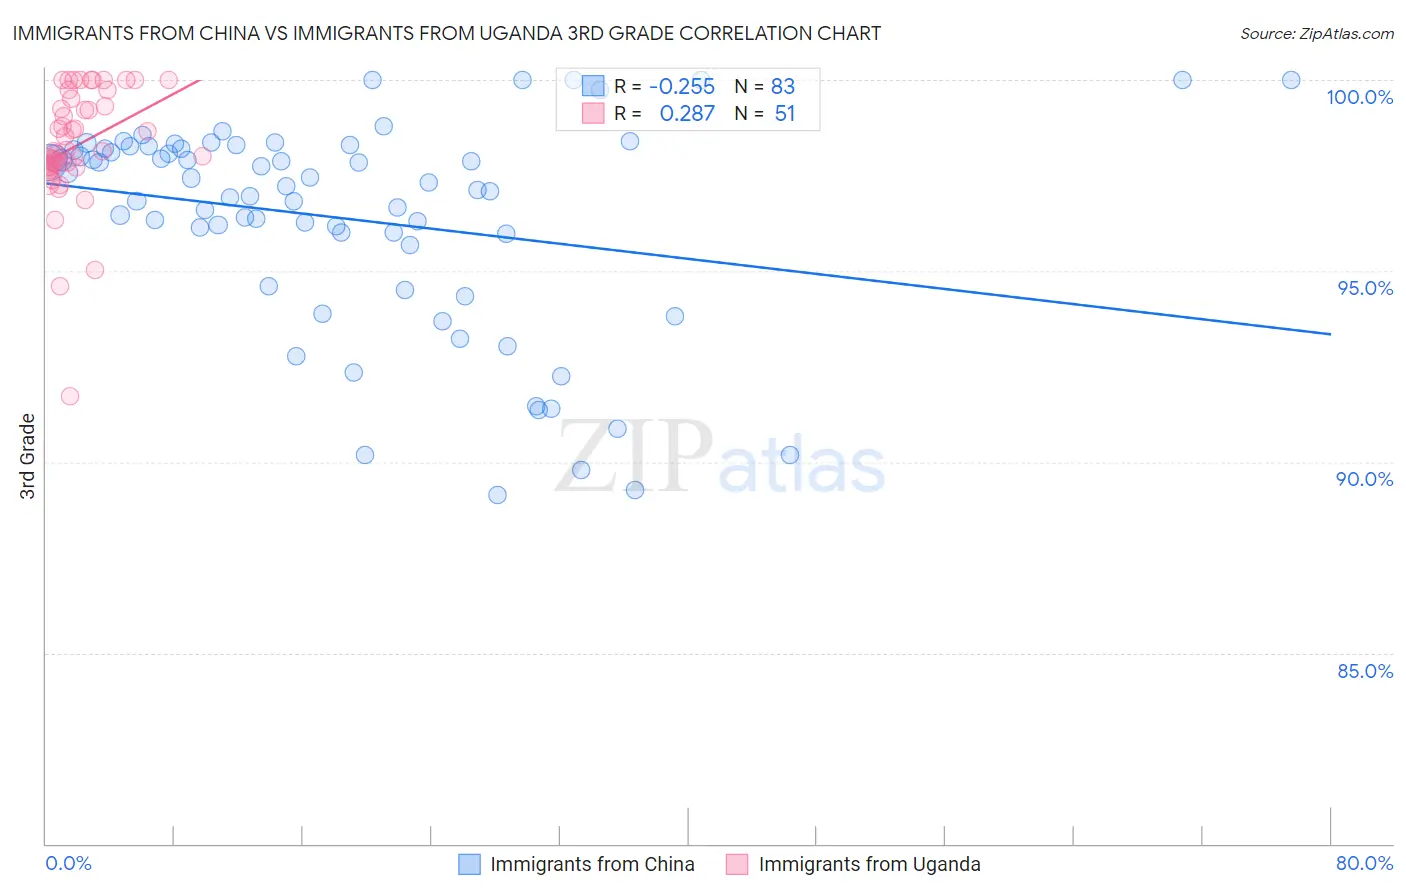
Immigrants from China vs Immigrants from Uganda 3rd Grade Correlation Chart
The statistical analysis conducted on geographies consisting of 457,082,957 people shows a weak negative correlation between the proportion of Immigrants from China and percentage of population with at least 3rd grade education in the United States with a correlation coefficient (R) of -0.255 and weighted average of 97.2%. Similarly, the statistical analysis conducted on geographies consisting of 125,908,537 people shows a weak positive correlation between the proportion of Immigrants from Uganda and percentage of population with at least 3rd grade education in the United States with a correlation coefficient (R) of 0.287 and weighted average of 97.7%, a difference of 0.47%.
3rd Grade Correlation Summary
| Measurement | Immigrants from China | Immigrants from Uganda |
| Minimum | 89.1% | 91.7% |
| Maximum | 100.0% | 100.0% |
| Range | 10.9% | 8.3% |
| Mean | 96.4% | 98.3% |
| Median | 97.2% | 98.1% |
| Interquartile 25% (IQ1) | 95.7% | 97.7% |
| Interquartile 75% (IQ3) | 98.2% | 99.5% |
| Interquartile Range (IQR) | 2.5% | 1.8% |
| Standard Deviation (Sample) | 2.8% | 1.6% |
| Standard Deviation (Population) | 2.7% | 1.5% |
Similar Demographics by 3rd Grade
Demographics Similar to Immigrants from China by 3rd Grade
In terms of 3rd grade, the demographic groups most similar to Immigrants from China are Puerto Rican (97.2%, a difference of 0.010%), Ghanaian (97.2%, a difference of 0.010%), Immigrants from Peru (97.2%, a difference of 0.010%), Immigrants from Cameroon (97.2%, a difference of 0.010%), and Cuban (97.3%, a difference of 0.030%).
| Demographics | Rating | Rank | 3rd Grade |
| Taiwanese | 0.3 /100 | #263 | Tragic 97.3% |
| West Indians | 0.3 /100 | #264 | Tragic 97.3% |
| Immigrants | Jamaica | 0.3 /100 | #265 | Tragic 97.3% |
| Yaqui | 0.3 /100 | #266 | Tragic 97.3% |
| Immigrants | Nigeria | 0.3 /100 | #267 | Tragic 97.3% |
| Cubans | 0.2 /100 | #268 | Tragic 97.3% |
| Fijians | 0.2 /100 | #269 | Tragic 97.3% |
| Immigrants | China | 0.2 /100 | #270 | Tragic 97.2% |
| Puerto Ricans | 0.2 /100 | #271 | Tragic 97.2% |
| Ghanaians | 0.1 /100 | #272 | Tragic 97.2% |
| Immigrants | Peru | 0.1 /100 | #273 | Tragic 97.2% |
| Immigrants | Cameroon | 0.1 /100 | #274 | Tragic 97.2% |
| Immigrants | Uzbekistan | 0.1 /100 | #275 | Tragic 97.2% |
| Immigrants | Bolivia | 0.1 /100 | #276 | Tragic 97.2% |
| Trinidadians and Tobagonians | 0.1 /100 | #277 | Tragic 97.2% |
Demographics Similar to Immigrants from Uganda by 3rd Grade
In terms of 3rd grade, the demographic groups most similar to Immigrants from Uganda are Immigrants from Kenya (97.7%, a difference of 0.0%), Immigrants from Egypt (97.7%, a difference of 0.0%), Black/African American (97.7%, a difference of 0.010%), Mongolian (97.7%, a difference of 0.010%), and Paraguayan (97.7%, a difference of 0.010%).
| Demographics | Rating | Rank | 3rd Grade |
| Natives/Alaskans | 35.2 /100 | #187 | Fair 97.7% |
| Immigrants | Taiwan | 34.2 /100 | #188 | Fair 97.7% |
| Pakistanis | 34.2 /100 | #189 | Fair 97.7% |
| Panamanians | 31.5 /100 | #190 | Fair 97.7% |
| Blacks/African Americans | 29.6 /100 | #191 | Fair 97.7% |
| Mongolians | 29.1 /100 | #192 | Fair 97.7% |
| Immigrants | Kenya | 28.2 /100 | #193 | Fair 97.7% |
| Immigrants | Uganda | 27.4 /100 | #194 | Fair 97.7% |
| Immigrants | Egypt | 26.8 /100 | #195 | Fair 97.7% |
| Paraguayans | 26.2 /100 | #196 | Fair 97.7% |
| Hawaiians | 25.7 /100 | #197 | Fair 97.7% |
| Guamanians/Chamorros | 23.6 /100 | #198 | Fair 97.7% |
| Immigrants | Ukraine | 22.7 /100 | #199 | Fair 97.7% |
| Immigrants | Albania | 22.6 /100 | #200 | Fair 97.7% |
| Immigrants | Lebanon | 21.7 /100 | #201 | Fair 97.7% |