Immigrants from China vs Marshallese 3rd Grade
COMPARE
Immigrants from China
Marshallese
3rd Grade
3rd Grade Comparison
Immigrants from China
Marshallese
97.2%
3RD GRADE
0.2/ 100
METRIC RATING
270th/ 347
METRIC RANK
97.8%
3RD GRADE
57.2/ 100
METRIC RATING
163rd/ 347
METRIC RANK
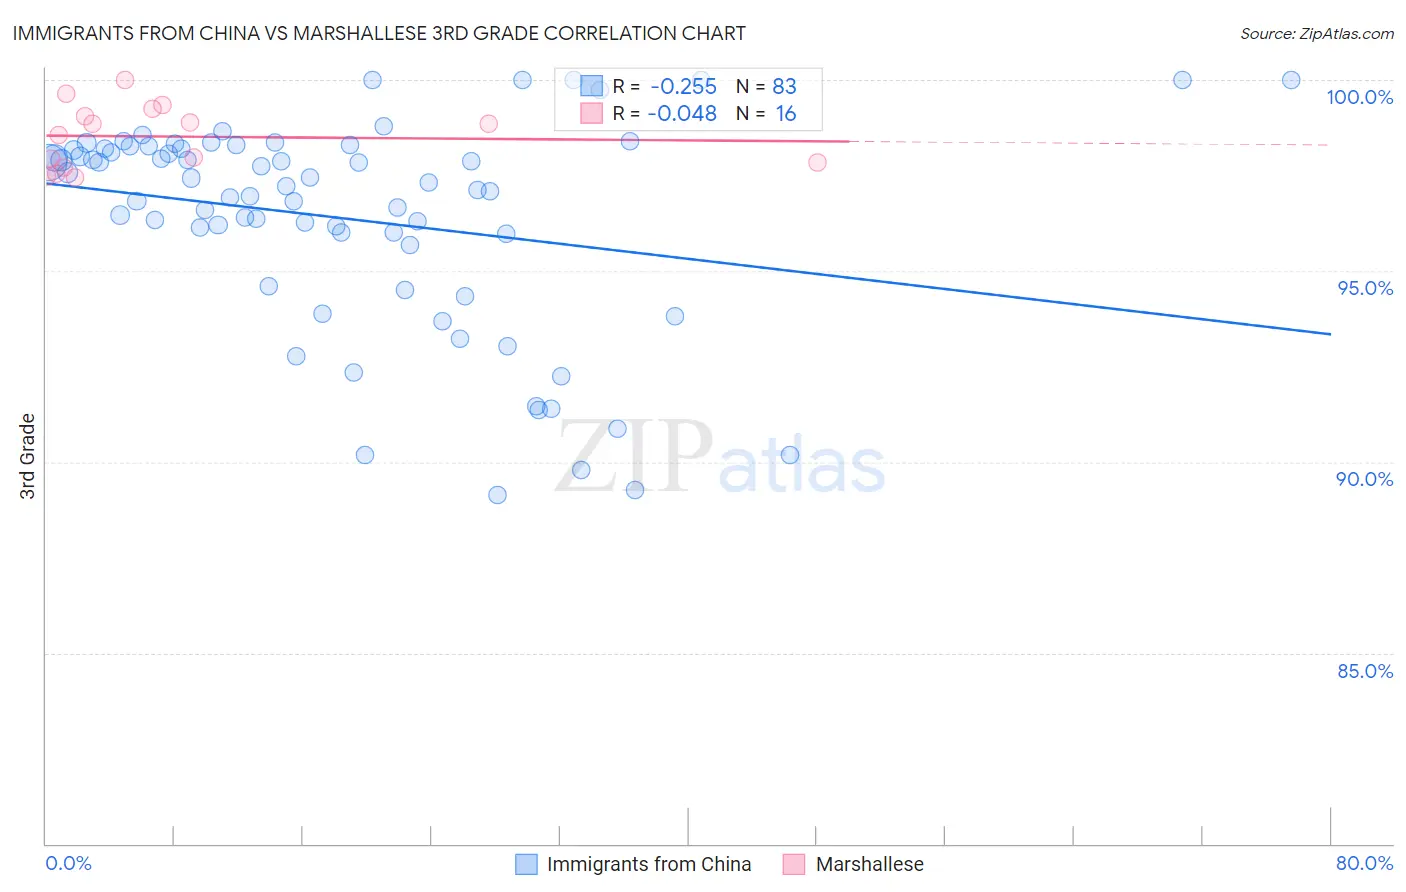
Immigrants from China vs Marshallese 3rd Grade Correlation Chart
The statistical analysis conducted on geographies consisting of 457,082,957 people shows a weak negative correlation between the proportion of Immigrants from China and percentage of population with at least 3rd grade education in the United States with a correlation coefficient (R) of -0.255 and weighted average of 97.2%. Similarly, the statistical analysis conducted on geographies consisting of 14,761,315 people shows no correlation between the proportion of Marshallese and percentage of population with at least 3rd grade education in the United States with a correlation coefficient (R) of -0.048 and weighted average of 97.8%, a difference of 0.57%.
3rd Grade Correlation Summary
| Measurement | Immigrants from China | Marshallese |
| Minimum | 89.1% | 97.4% |
| Maximum | 100.0% | 100.0% |
| Range | 10.9% | 2.6% |
| Mean | 96.4% | 98.5% |
| Median | 97.2% | 98.7% |
| Interquartile 25% (IQ1) | 95.7% | 97.8% |
| Interquartile 75% (IQ3) | 98.2% | 99.1% |
| Interquartile Range (IQR) | 2.5% | 1.4% |
| Standard Deviation (Sample) | 2.8% | 0.83% |
| Standard Deviation (Population) | 2.7% | 0.80% |
Similar Demographics by 3rd Grade
Demographics Similar to Immigrants from China by 3rd Grade
In terms of 3rd grade, the demographic groups most similar to Immigrants from China are Puerto Rican (97.2%, a difference of 0.010%), Ghanaian (97.2%, a difference of 0.010%), Immigrants from Peru (97.2%, a difference of 0.010%), Immigrants from Cameroon (97.2%, a difference of 0.010%), and Cuban (97.3%, a difference of 0.030%).
| Demographics | Rating | Rank | 3rd Grade |
| Taiwanese | 0.3 /100 | #263 | Tragic 97.3% |
| West Indians | 0.3 /100 | #264 | Tragic 97.3% |
| Immigrants | Jamaica | 0.3 /100 | #265 | Tragic 97.3% |
| Yaqui | 0.3 /100 | #266 | Tragic 97.3% |
| Immigrants | Nigeria | 0.3 /100 | #267 | Tragic 97.3% |
| Cubans | 0.2 /100 | #268 | Tragic 97.3% |
| Fijians | 0.2 /100 | #269 | Tragic 97.3% |
| Immigrants | China | 0.2 /100 | #270 | Tragic 97.2% |
| Puerto Ricans | 0.2 /100 | #271 | Tragic 97.2% |
| Ghanaians | 0.1 /100 | #272 | Tragic 97.2% |
| Immigrants | Peru | 0.1 /100 | #273 | Tragic 97.2% |
| Immigrants | Cameroon | 0.1 /100 | #274 | Tragic 97.2% |
| Immigrants | Uzbekistan | 0.1 /100 | #275 | Tragic 97.2% |
| Immigrants | Bolivia | 0.1 /100 | #276 | Tragic 97.2% |
| Trinidadians and Tobagonians | 0.1 /100 | #277 | Tragic 97.2% |
Demographics Similar to Marshallese by 3rd Grade
In terms of 3rd grade, the demographic groups most similar to Marshallese are Immigrants from Jordan (97.8%, a difference of 0.0%), Immigrants from Bosnia and Herzegovina (97.8%, a difference of 0.0%), Ugandan (97.8%, a difference of 0.0%), Immigrants from Italy (97.8%, a difference of 0.010%), and Venezuelan (97.8%, a difference of 0.010%).
| Demographics | Rating | Rank | 3rd Grade |
| Immigrants | Russia | 61.7 /100 | #156 | Good 97.8% |
| Immigrants | Italy | 61.2 /100 | #157 | Good 97.8% |
| Venezuelans | 60.9 /100 | #158 | Good 97.8% |
| French American Indians | 60.0 /100 | #159 | Average 97.8% |
| Immigrants | Iran | 59.1 /100 | #160 | Average 97.8% |
| Albanians | 58.8 /100 | #161 | Average 97.8% |
| Immigrants | Jordan | 57.9 /100 | #162 | Average 97.8% |
| Marshallese | 57.2 /100 | #163 | Average 97.8% |
| Immigrants | Bosnia and Herzegovina | 56.2 /100 | #164 | Average 97.8% |
| Ugandans | 56.1 /100 | #165 | Average 97.8% |
| Dutch West Indians | 55.5 /100 | #166 | Average 97.8% |
| Chileans | 55.3 /100 | #167 | Average 97.8% |
| Immigrants | Spain | 54.3 /100 | #168 | Average 97.8% |
| Comanche | 53.8 /100 | #169 | Average 97.8% |
| Brazilians | 53.7 /100 | #170 | Average 97.8% |