Serbian vs Immigrants from Uganda 3rd Grade
COMPARE
Serbian
Immigrants from Uganda
3rd Grade
3rd Grade Comparison
Serbians
Immigrants from Uganda
98.2%
3RD GRADE
99.6/ 100
METRIC RATING
66th/ 347
METRIC RANK
97.7%
3RD GRADE
27.4/ 100
METRIC RATING
194th/ 347
METRIC RANK
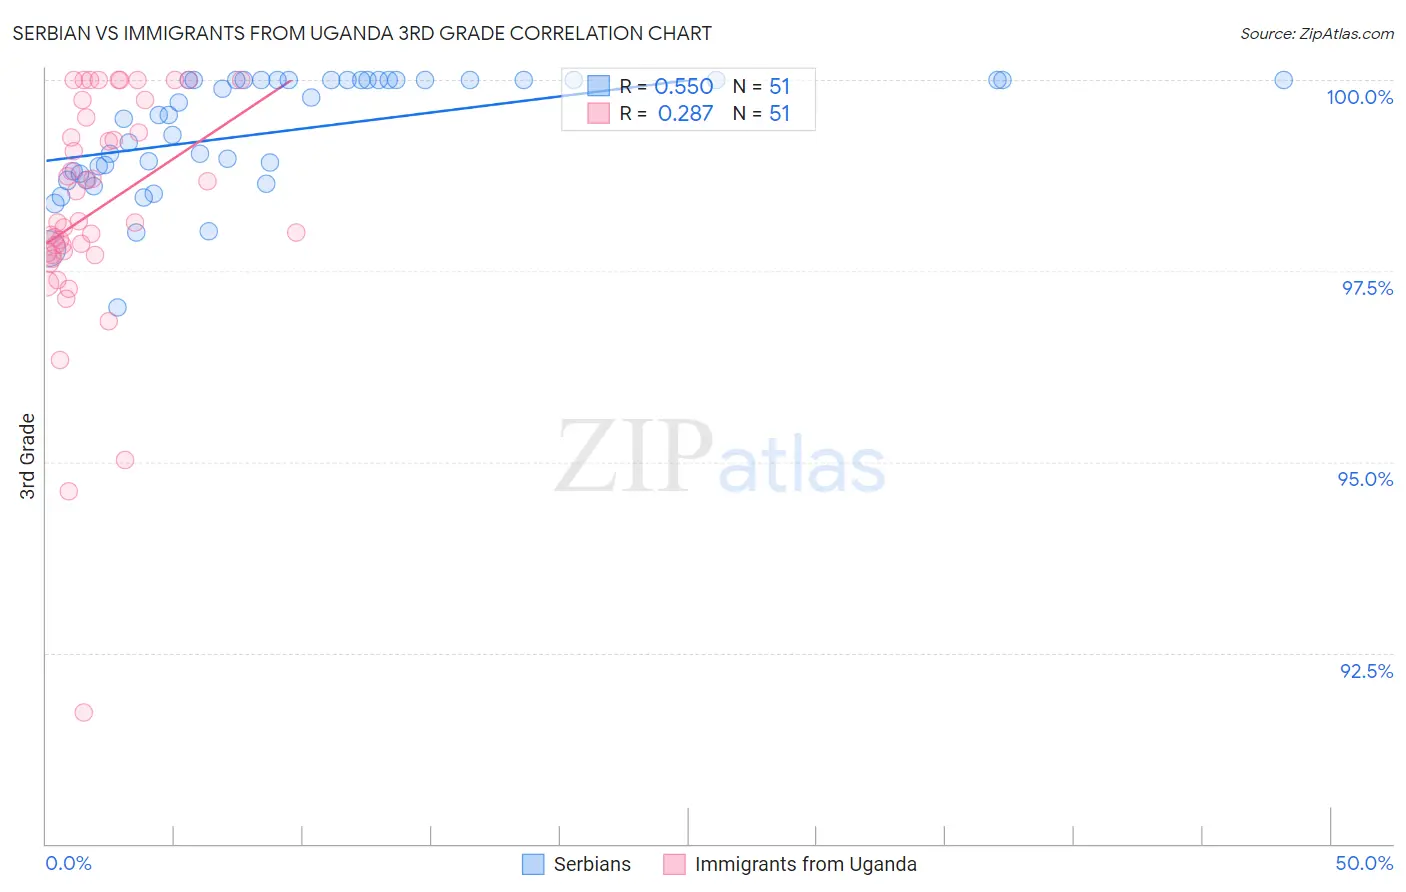
Serbian vs Immigrants from Uganda 3rd Grade Correlation Chart
The statistical analysis conducted on geographies consisting of 267,642,942 people shows a substantial positive correlation between the proportion of Serbians and percentage of population with at least 3rd grade education in the United States with a correlation coefficient (R) of 0.550 and weighted average of 98.2%. Similarly, the statistical analysis conducted on geographies consisting of 125,908,537 people shows a weak positive correlation between the proportion of Immigrants from Uganda and percentage of population with at least 3rd grade education in the United States with a correlation coefficient (R) of 0.287 and weighted average of 97.7%, a difference of 0.56%.
3rd Grade Correlation Summary
| Measurement | Serbian | Immigrants from Uganda |
| Minimum | 97.0% | 91.7% |
| Maximum | 100.0% | 100.0% |
| Range | 3.0% | 8.3% |
| Mean | 99.3% | 98.3% |
| Median | 99.5% | 98.1% |
| Interquartile 25% (IQ1) | 98.8% | 97.7% |
| Interquartile 75% (IQ3) | 100.0% | 99.5% |
| Interquartile Range (IQR) | 1.2% | 1.8% |
| Standard Deviation (Sample) | 0.75% | 1.6% |
| Standard Deviation (Population) | 0.75% | 1.5% |
Similar Demographics by 3rd Grade
Demographics Similar to Serbians by 3rd Grade
In terms of 3rd grade, the demographic groups most similar to Serbians are New Zealander (98.2%, a difference of 0.0%), Russian (98.2%, a difference of 0.0%), Immigrants from Northern Europe (98.2%, a difference of 0.0%), Canadian (98.2%, a difference of 0.0%), and Kiowa (98.2%, a difference of 0.010%).
| Demographics | Rating | Rank | 3rd Grade |
| Maltese | 99.7 /100 | #59 | Exceptional 98.3% |
| Creek | 99.7 /100 | #60 | Exceptional 98.2% |
| Pueblo | 99.7 /100 | #61 | Exceptional 98.2% |
| Immigrants | Canada | 99.7 /100 | #62 | Exceptional 98.2% |
| Immigrants | North America | 99.7 /100 | #63 | Exceptional 98.2% |
| Kiowa | 99.6 /100 | #64 | Exceptional 98.2% |
| New Zealanders | 99.6 /100 | #65 | Exceptional 98.2% |
| Serbians | 99.6 /100 | #66 | Exceptional 98.2% |
| Russians | 99.6 /100 | #67 | Exceptional 98.2% |
| Immigrants | Northern Europe | 99.6 /100 | #68 | Exceptional 98.2% |
| Canadians | 99.6 /100 | #69 | Exceptional 98.2% |
| Cajuns | 99.6 /100 | #70 | Exceptional 98.2% |
| Immigrants | Austria | 99.6 /100 | #71 | Exceptional 98.2% |
| Chickasaw | 99.5 /100 | #72 | Exceptional 98.2% |
| Cheyenne | 99.3 /100 | #73 | Exceptional 98.2% |
Demographics Similar to Immigrants from Uganda by 3rd Grade
In terms of 3rd grade, the demographic groups most similar to Immigrants from Uganda are Immigrants from Kenya (97.7%, a difference of 0.0%), Immigrants from Egypt (97.7%, a difference of 0.0%), Black/African American (97.7%, a difference of 0.010%), Mongolian (97.7%, a difference of 0.010%), and Paraguayan (97.7%, a difference of 0.010%).
| Demographics | Rating | Rank | 3rd Grade |
| Natives/Alaskans | 35.2 /100 | #187 | Fair 97.7% |
| Immigrants | Taiwan | 34.2 /100 | #188 | Fair 97.7% |
| Pakistanis | 34.2 /100 | #189 | Fair 97.7% |
| Panamanians | 31.5 /100 | #190 | Fair 97.7% |
| Blacks/African Americans | 29.6 /100 | #191 | Fair 97.7% |
| Mongolians | 29.1 /100 | #192 | Fair 97.7% |
| Immigrants | Kenya | 28.2 /100 | #193 | Fair 97.7% |
| Immigrants | Uganda | 27.4 /100 | #194 | Fair 97.7% |
| Immigrants | Egypt | 26.8 /100 | #195 | Fair 97.7% |
| Paraguayans | 26.2 /100 | #196 | Fair 97.7% |
| Hawaiians | 25.7 /100 | #197 | Fair 97.7% |
| Guamanians/Chamorros | 23.6 /100 | #198 | Fair 97.7% |
| Immigrants | Ukraine | 22.7 /100 | #199 | Fair 97.7% |
| Immigrants | Albania | 22.6 /100 | #200 | Fair 97.7% |
| Immigrants | Lebanon | 21.7 /100 | #201 | Fair 97.7% |