Immigrants from Burma/Myanmar vs Albanian High School Diploma
COMPARE
Immigrants from Burma/Myanmar
Albanian
High School Diploma
High School Diploma Comparison
Immigrants from Burma/Myanmar
Albanians
86.7%
HIGH SCHOOL DIPLOMA
0.1/ 100
METRIC RATING
276th/ 347
METRIC RANK
89.8%
HIGH SCHOOL DIPLOMA
87.2/ 100
METRIC RATING
133rd/ 347
METRIC RANK
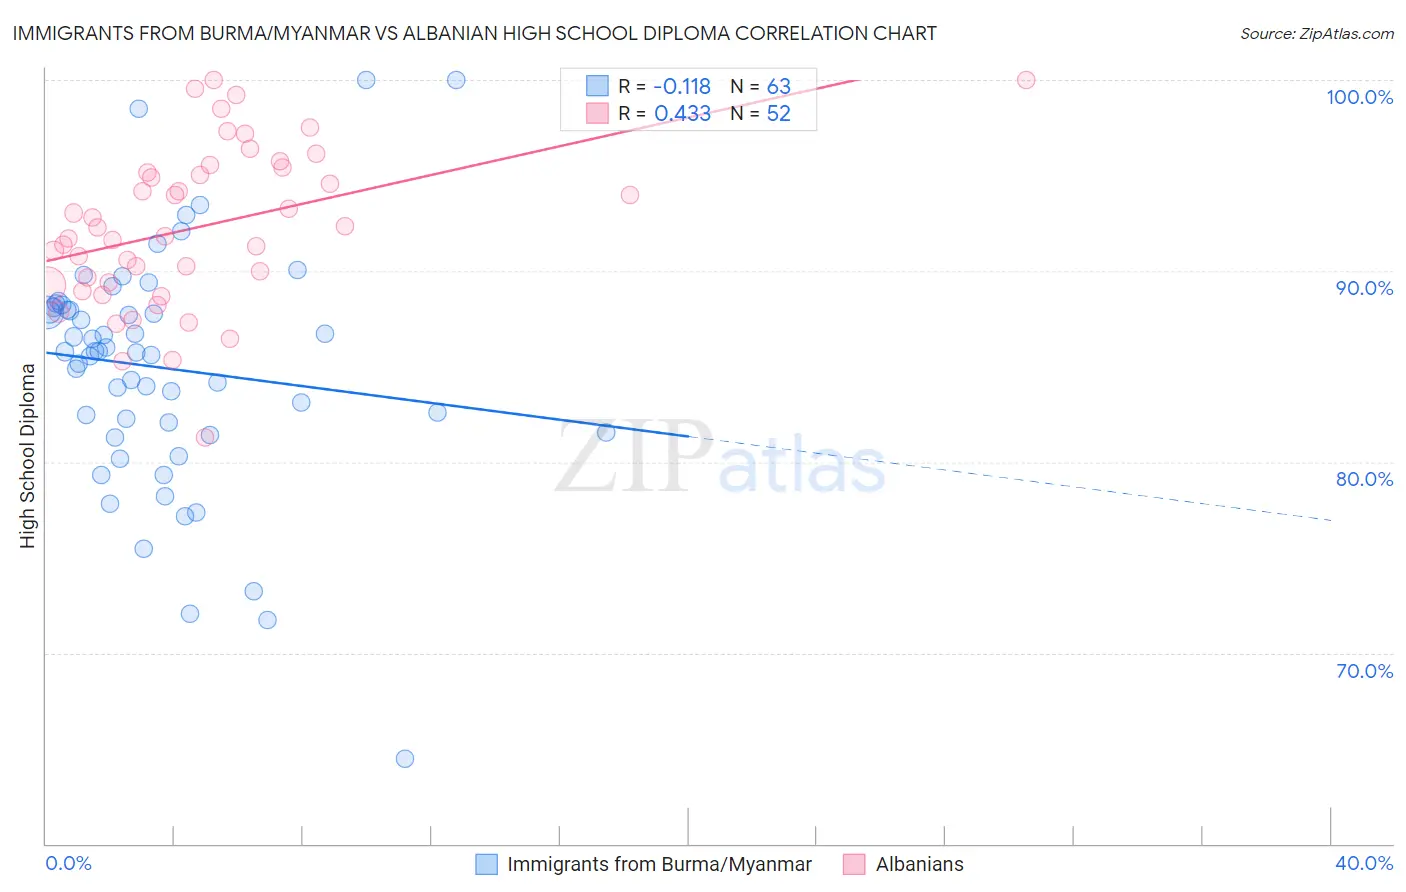
Immigrants from Burma/Myanmar vs Albanian High School Diploma Correlation Chart
The statistical analysis conducted on geographies consisting of 172,345,696 people shows a poor negative correlation between the proportion of Immigrants from Burma/Myanmar and percentage of population with at least high school diploma education in the United States with a correlation coefficient (R) of -0.118 and weighted average of 86.7%. Similarly, the statistical analysis conducted on geographies consisting of 193,265,850 people shows a moderate positive correlation between the proportion of Albanians and percentage of population with at least high school diploma education in the United States with a correlation coefficient (R) of 0.433 and weighted average of 89.8%, a difference of 3.6%.
High School Diploma Correlation Summary
| Measurement | Immigrants from Burma/Myanmar | Albanian |
| Minimum | 64.5% | 81.3% |
| Maximum | 100.0% | 100.0% |
| Range | 35.5% | 18.7% |
| Mean | 84.9% | 92.3% |
| Median | 85.8% | 92.1% |
| Interquartile 25% (IQ1) | 81.5% | 89.3% |
| Interquartile 75% (IQ3) | 88.1% | 95.3% |
| Interquartile Range (IQR) | 6.6% | 6.0% |
| Standard Deviation (Sample) | 6.3% | 4.2% |
| Standard Deviation (Population) | 6.3% | 4.1% |
Similar Demographics by High School Diploma
Demographics Similar to Immigrants from Burma/Myanmar by High School Diploma
In terms of high school diploma, the demographic groups most similar to Immigrants from Burma/Myanmar are Barbadian (86.7%, a difference of 0.010%), Immigrants from Trinidad and Tobago (86.8%, a difference of 0.070%), Hopi (86.6%, a difference of 0.11%), Immigrants from Laos (86.6%, a difference of 0.16%), and Pueblo (86.5%, a difference of 0.18%).
| Demographics | Rating | Rank | High School Diploma |
| Sri Lankans | 0.2 /100 | #269 | Tragic 87.0% |
| Malaysians | 0.2 /100 | #270 | Tragic 87.0% |
| West Indians | 0.1 /100 | #271 | Tragic 86.9% |
| Trinidadians and Tobagonians | 0.1 /100 | #272 | Tragic 86.9% |
| Immigrants | Jamaica | 0.1 /100 | #273 | Tragic 86.9% |
| Bangladeshis | 0.1 /100 | #274 | Tragic 86.9% |
| Immigrants | Trinidad and Tobago | 0.1 /100 | #275 | Tragic 86.8% |
| Immigrants | Burma/Myanmar | 0.1 /100 | #276 | Tragic 86.7% |
| Barbadians | 0.1 /100 | #277 | Tragic 86.7% |
| Hopi | 0.1 /100 | #278 | Tragic 86.6% |
| Immigrants | Laos | 0.0 /100 | #279 | Tragic 86.6% |
| Pueblo | 0.0 /100 | #280 | Tragic 86.5% |
| Indonesians | 0.0 /100 | #281 | Tragic 86.5% |
| Dutch West Indians | 0.0 /100 | #282 | Tragic 86.5% |
| Immigrants | Barbados | 0.0 /100 | #283 | Tragic 86.4% |
Demographics Similar to Albanians by High School Diploma
In terms of high school diploma, the demographic groups most similar to Albanians are Immigrants from Bosnia and Herzegovina (89.8%, a difference of 0.0%), Immigrants from Jordan (89.8%, a difference of 0.0%), Immigrants from Italy (89.8%, a difference of 0.010%), Immigrants from Ukraine (89.8%, a difference of 0.020%), and Basque (89.8%, a difference of 0.040%).
| Demographics | Rating | Rank | High School Diploma |
| Alaska Natives | 91.0 /100 | #126 | Exceptional 89.9% |
| Immigrants | Eastern Asia | 89.2 /100 | #127 | Excellent 89.9% |
| Puget Sound Salish | 89.1 /100 | #128 | Excellent 89.9% |
| Basques | 88.5 /100 | #129 | Excellent 89.8% |
| Immigrants | Ukraine | 87.9 /100 | #130 | Excellent 89.8% |
| Immigrants | Italy | 87.4 /100 | #131 | Excellent 89.8% |
| Immigrants | Bosnia and Herzegovina | 87.3 /100 | #132 | Excellent 89.8% |
| Albanians | 87.2 /100 | #133 | Excellent 89.8% |
| Immigrants | Jordan | 87.2 /100 | #134 | Excellent 89.8% |
| Chippewa | 85.6 /100 | #135 | Excellent 89.7% |
| Ugandans | 83.7 /100 | #136 | Excellent 89.7% |
| Arabs | 83.6 /100 | #137 | Excellent 89.7% |
| Assyrians/Chaldeans/Syriacs | 82.5 /100 | #138 | Excellent 89.7% |
| Kenyans | 81.4 /100 | #139 | Excellent 89.6% |
| Immigrants | Egypt | 81.2 /100 | #140 | Excellent 89.6% |