Immigrants from Iraq vs Albanian High School Diploma
COMPARE
Immigrants from Iraq
Albanian
High School Diploma
High School Diploma Comparison
Immigrants from Iraq
Albanians
89.4%
HIGH SCHOOL DIPLOMA
68.7/ 100
METRIC RATING
153rd/ 347
METRIC RANK
89.8%
HIGH SCHOOL DIPLOMA
87.2/ 100
METRIC RATING
133rd/ 347
METRIC RANK
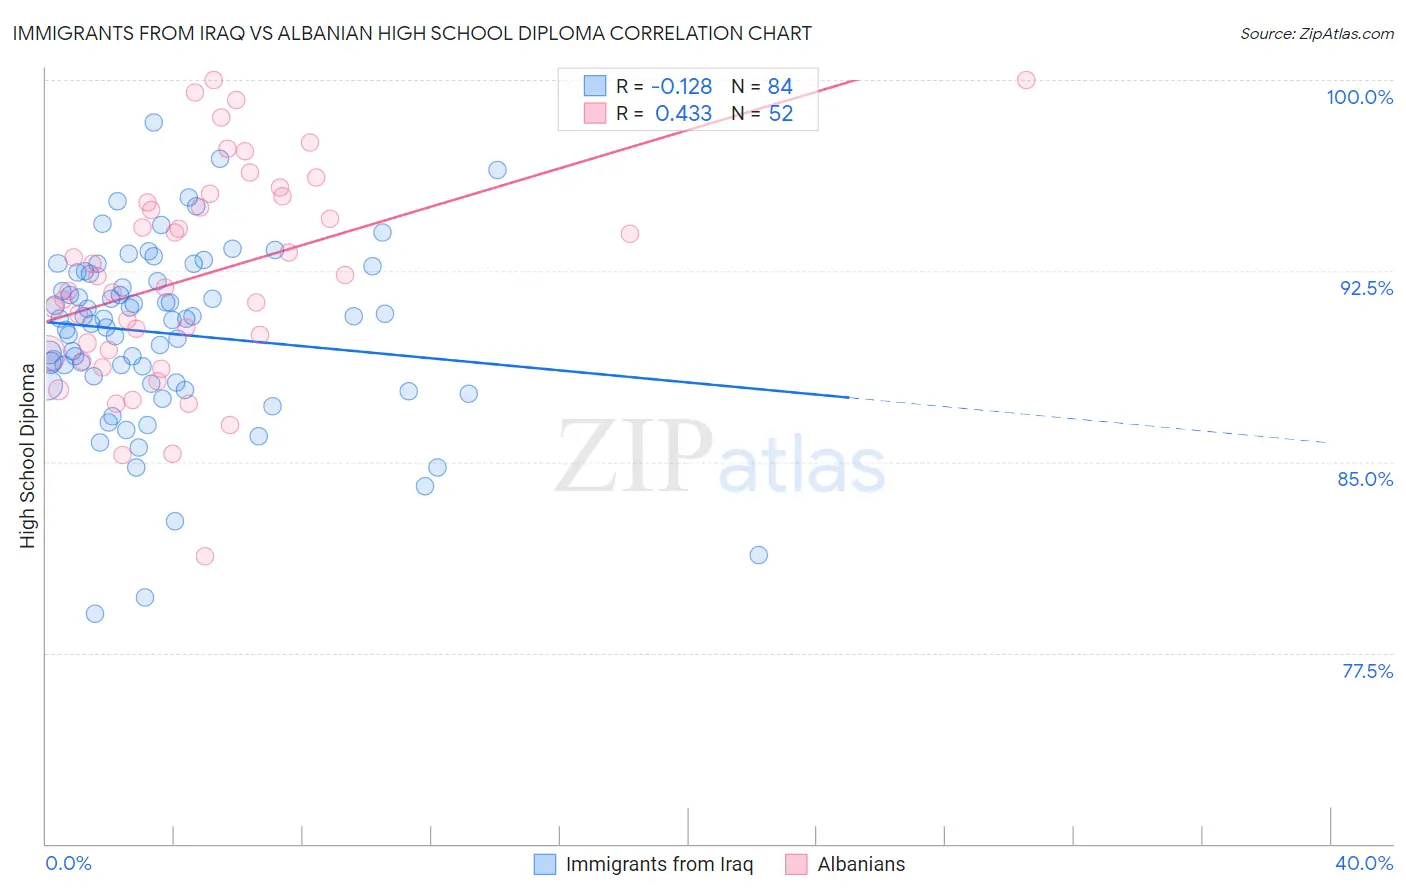
Immigrants from Iraq vs Albanian High School Diploma Correlation Chart
The statistical analysis conducted on geographies consisting of 194,726,982 people shows a poor negative correlation between the proportion of Immigrants from Iraq and percentage of population with at least high school diploma education in the United States with a correlation coefficient (R) of -0.128 and weighted average of 89.4%. Similarly, the statistical analysis conducted on geographies consisting of 193,265,850 people shows a moderate positive correlation between the proportion of Albanians and percentage of population with at least high school diploma education in the United States with a correlation coefficient (R) of 0.433 and weighted average of 89.8%, a difference of 0.43%.
High School Diploma Correlation Summary
| Measurement | Immigrants from Iraq | Albanian |
| Minimum | 79.0% | 81.3% |
| Maximum | 98.3% | 100.0% |
| Range | 19.3% | 18.7% |
| Mean | 90.0% | 92.3% |
| Median | 90.6% | 92.1% |
| Interquartile 25% (IQ1) | 88.1% | 89.3% |
| Interquartile 75% (IQ3) | 92.4% | 95.3% |
| Interquartile Range (IQR) | 4.3% | 6.0% |
| Standard Deviation (Sample) | 3.5% | 4.2% |
| Standard Deviation (Population) | 3.5% | 4.1% |
Demographics Similar to Immigrants from Iraq and Albanians by High School Diploma
In terms of high school diploma, the demographic groups most similar to Immigrants from Iraq are Asian (89.4%, a difference of 0.040%), Paraguayan (89.5%, a difference of 0.050%), Argentinean (89.5%, a difference of 0.070%), Immigrants from Poland (89.5%, a difference of 0.080%), and Immigrants from Lebanon (89.5%, a difference of 0.090%). Similarly, the demographic groups most similar to Albanians are Immigrants from Jordan (89.8%, a difference of 0.0%), Chippewa (89.7%, a difference of 0.050%), Ugandan (89.7%, a difference of 0.11%), Arab (89.7%, a difference of 0.11%), and Assyrian/Chaldean/Syriac (89.7%, a difference of 0.14%).
| Demographics | Rating | Rank | High School Diploma |
| Albanians | 87.2 /100 | #133 | Excellent 89.8% |
| Immigrants | Jordan | 87.2 /100 | #134 | Excellent 89.8% |
| Chippewa | 85.6 /100 | #135 | Excellent 89.7% |
| Ugandans | 83.7 /100 | #136 | Excellent 89.7% |
| Arabs | 83.6 /100 | #137 | Excellent 89.7% |
| Assyrians/Chaldeans/Syriacs | 82.5 /100 | #138 | Excellent 89.7% |
| Kenyans | 81.4 /100 | #139 | Excellent 89.6% |
| Immigrants | Egypt | 81.2 /100 | #140 | Excellent 89.6% |
| Chileans | 79.0 /100 | #141 | Good 89.6% |
| Indians (Asian) | 78.8 /100 | #142 | Good 89.6% |
| Pakistanis | 78.3 /100 | #143 | Good 89.6% |
| Immigrants | Kenya | 78.0 /100 | #144 | Good 89.6% |
| Immigrants | Brazil | 76.6 /100 | #145 | Good 89.5% |
| Immigrants | Spain | 76.2 /100 | #146 | Good 89.5% |
| Iraqis | 73.9 /100 | #147 | Good 89.5% |
| Immigrants | Lebanon | 73.4 /100 | #148 | Good 89.5% |
| Immigrants | Poland | 72.9 /100 | #149 | Good 89.5% |
| Argentineans | 72.3 /100 | #150 | Good 89.5% |
| Paraguayans | 71.4 /100 | #151 | Good 89.5% |
| Asians | 70.7 /100 | #152 | Good 89.4% |
| Immigrants | Iraq | 68.7 /100 | #153 | Good 89.4% |